The 2017/18 csv has been replaced with a revised version to correct an error and include breakdowns by weekly working hours.
22 April 2025 13:53 PM
3. Earnings and Expenses Estimates by Gender, Age and Weekly Working Hours for GPs in England
This chapter presents earnings and expenses information by weekly working hours and gender for GPs working in England as either a contractor or salaried GP under a General Medical Services (GMS) or Personal Medical Services (PMS) contract and, as with all results in this report, covers both their NHS and private income.
This analysis was first conducted and published as experimental statistics for the 2016/17 financial year. Consequently, this is the first report in which year-on-year comparisons are possible.
Working hours bandings were derived from the contracted hours (or average weekly hours if blank) fields within wMDS. Three bandings have been used in this experimental analysis:
- Up to 22.5 hours
- 22.5 up to 37.5 hours
- 37.5 hours and more
These bandings were chosen to provide a large enough sample to be able to analyse the figures by different groups of characteristics, because it is evident that working patterns and therefore earnings and expenses vary by gender, as well as by age band. (Earnings and expenses estimates by age band and weekly working hours are available in the accompanying Excel Annex 1 (see Resources on the Overview page).
England is the only UK country currently collecting record-level information on working hours.
The wMDS collects details of contracted hours and average weekly hours.
- The weekly hours bands supplied to HMRC have been calculated using data from the contracted hours field
- Where the contracted hours field was blank or contained 0, values from the average weekly hours field were used.
- Practices are advised that where a member of staff is not contracted to work a set number of hours, as is the likely case for contractor GPs, data should be entered into the average weekly hours field. However, the majority of practices enter data only in the contracted working hours field, regardless of whether the individual is a contractor or salaried GP.
Contractor and salaried GPs working for the NHS in England under GMS or PMS contracts are included in this report.
More information can be found on the wMDS data collection in the General Practice Workforce publication.
Interpreting the results
Care should be taken when interpreting the results in this chapter or the accompanying Excel Annex 1 (see Resources on the Overview page), particularly those that show differences in earnings according gender, age band or working hours bands. There are a variety of factors that may contribute to differences in incomes, including but not limited to the issues outlined in this section.
Contractor GPs’ earnings may be affected by the terms of any partnership agreements in effect for their practices. For example, some partners may invest in the practice premises, and such equity partners would receive taxable income as a result of this investment which could result in their having overall higher earnings than the other partners. No information is available on the age and gender profile of these equity partners, but it may be the case that younger GPs face greater pressures on their incomes and thus have less capacity for making such an investment. While females make up 43.2 percent of the overall contractor GP population, this figure falls to only 24.9 per cent of contractor GPs aged 60 and over and 41.3 per cent of GPs aged 50 to 59. It is therefore possible that the percentage of female equity partners is far lower than the comparable male percentage, which may partially account for the lower earnings of female contractor GPs.
It is not unreasonable that older GPs, having greater experience, receive higher earnings than their younger and less experienced colleagues. In addition, older contractor GPs may be eligible for seniority payments which are based upon a variety of factors including years of reckonable service. As female GPs are more likely to take career breaks, including absence for maternity leave, many may have fewer years’ reckonable service than male GPs of the same age, which would affect the size of any seniority payment received.
It is also possible that female GPs, both contractor and salaried, may be more likely to work fewer hours within the weekly working hours bands used in this report, which would have the effect of reducing their average income when compared to male GPs within the same band. Please refer to the GP population gender split for more details.
Known issues
Working hours
Many GPs work longer than their contracted hours and therefore the actual number of hours worked could be far higher than is suggested by the three bandings.
It could be the case that GPs who are apparently part-time according to the wMDS data also work additional hours elsewhere, for example delivering primary care in a hospital or alternative setting. Although relevant income would be recorded in the self-assessment tax return, these GPs would appear to be part-time for the purposes of this analysis.
The weekly hours bands supplied to HMRC have been calculated using contracted hours or average weekly hours as previoulsy outlined. However, it is possible that some GPs may work longer hours than those recorded within the wMDS.
Working hours information is a snapshot taken at 30 September 2017. A GP’s working pattern could have changed in the course of the financial year and therefore the hours worked during that quarter may not reflect the contracted or average hours worked during the rest of the financial year.
Any hours that a GP is contracted to work outside their practice will not be included in their working hours information in the wMDS. This could include private work, work in walk in centres, or as a locum at a different practice. However, their income from these sources would be included in the amounts reported in their Self-Assessment tax return and so in some cases, a GP’s weekly working hours may not reflect all the work they have been paid for.
The GP population gender split
Within the wMDS, women make up 53.1 per cent of the GP population but a far higher proportion of the part-time workforce.
As shown in Table 3.1, 73 per cent of all (combined) GPs who work fewer than 22.5 hours a week are female. In contrast, female GPs account for only 28.1 per cent of those who work 37.5 hours or more a week.
Table 3.1: Percentage of GPs that are female, by GP type and working hours band, 2017/18
| Weekly hours band | Combined | Contractor | Salaried |
|---|---|---|---|
|
<22.5 |
73.0 | 63.9 | 79.8 |
|
22.5 up to 37.5 |
58.3 | 51.0 | 72.7 |
|
>=37.5 |
28.1 | 25.1 | 47.1 |
Table 3.2: Percentage of GPs that are female, by GP type and age band, 2017/18
| Age band | Combined | Contractor | Salaried |
|---|---|---|---|
| Under 40 | 64.4 | 48.2 | 75.1 |
| 40 to 49 | 56.8 | 48.7 | 75.8 |
| 50 to 59 | 45.6 | 41.3 | 67.3 |
| 60 and over | 27.0 | 24.9 | 38.9 |
Note: Earnings and Expenses Estimates by age band and weekly working hours are available in the accompanying Excel Annex 1, available under Resources on the Overview page.
Data from the General Practice Workforce publications, which uses the wMDS as its source, suggests the profile of the GP workforce is changing as an increasing proportion of GPs are female. While women outnumber men in terms of headcount, a greater percentage of female GPs work part time.
The three weekly working hours bands used for this report were designed to avoid the likelihood of earnings and expenses estimates being suppressed due to small sample sizes, after HMRC has matched GPs to their Self-Assessment tax returns.
However, it is possible to use narrower bands when looking only at GPs’ weekly working hours from wMDS data.
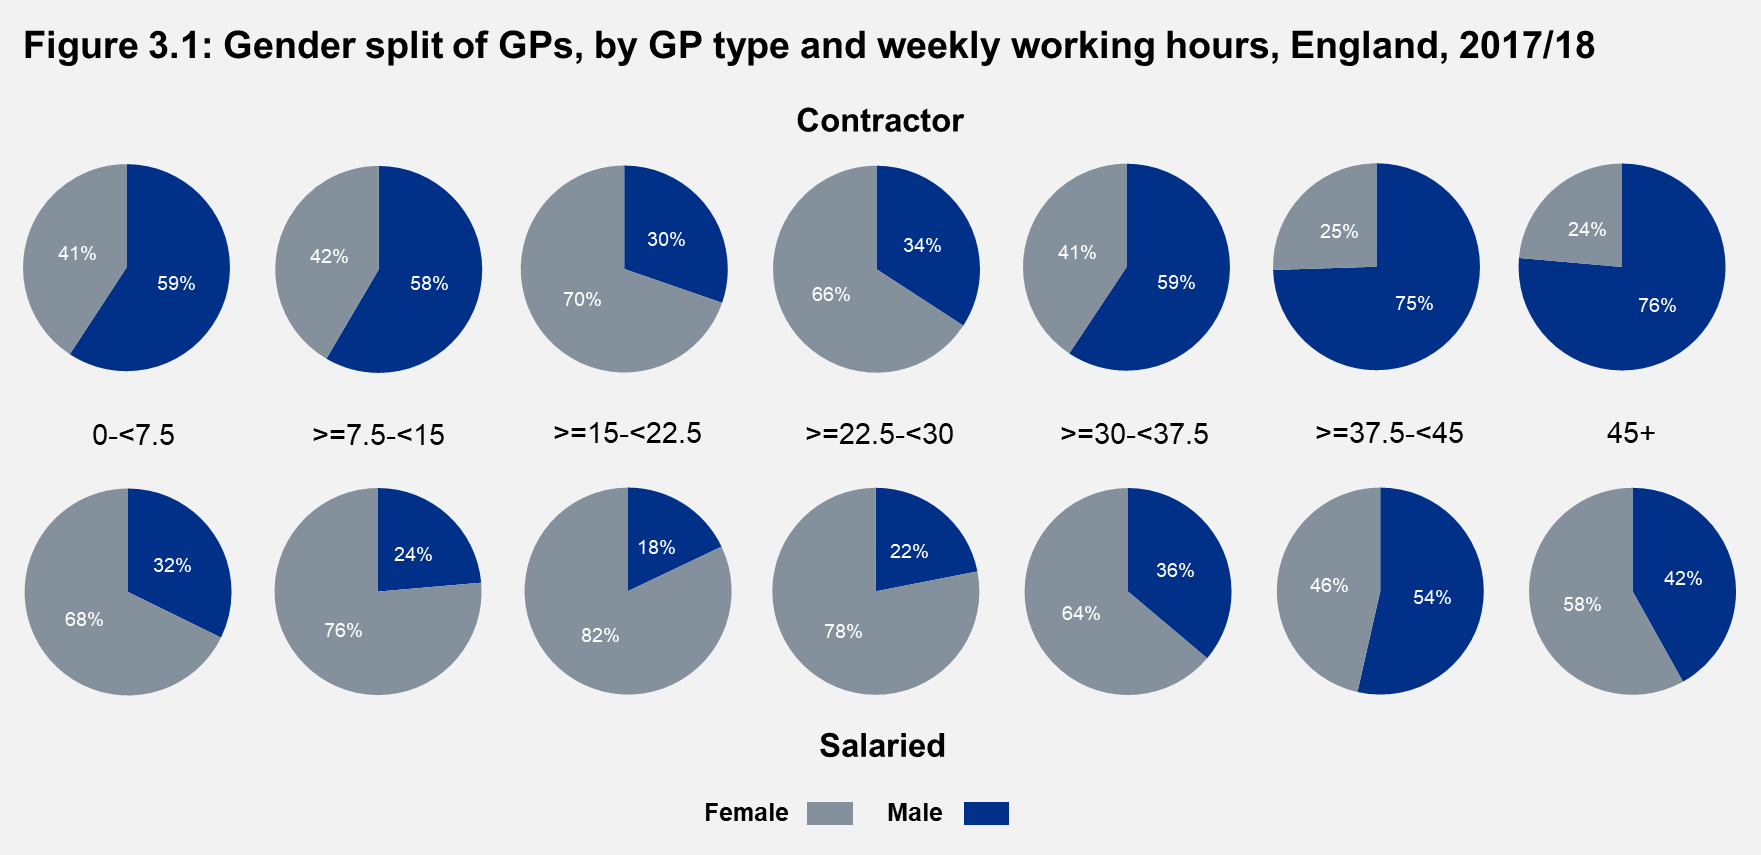
Figure 3.1 shows the split of male and female GPs from the wMDS at 30 September 2017 within weekly working hours bands of 7.5 hours. The figure shows that in general the greater proportion of GPs working shorter hours is female.
Within the two sub-divisions of the 22.5 to fewer than 37.5 analysis band in particular, it can be seen that females tend to be distributed towards the lower subdivision (22.5 to under 30 hours). This should be considered when interpreting earnings and expenses estimates, as the greater distribution of females in the lower subdivision could have the effect of pulling down average earnings of female GPs within the wider 22.5 to under 37.5 hours band, when compared to results for male GPs.
See Annex A for counts of GPs from the England report population by weekly working hours band and gender.
Contractor GPs
- As was the case in 2016/17 and as would be expected, income before tax, total expenses and gross earnings estimates of GPMS contractor GPs in England in 2017/18 all increased as more weekly hours were worked. Income before tax for GPs working 37.5 or more weekly hours was 70.5 per cent higher than for colleagues working fewer than 22.5 hours.
Table 3.3: GPMS contractors GPs - average earnings and expenses by weekly working hours, England, 2016/17 and 2017/18
- When split by gender, income before tax, total expenses and gross earnings were all higher for male GPs than female GPs regardless of their weekly hours band
Table 3.4: GPMS contractors GPs - average earnings and expenses by weekly working hours and gender, England, 2016/17 and 2017/18
- Among GPs working fewer than 22.5 hours a week, female GPs’ average income before tax increased by 4 per cent, in contrast to their male equivalents, for whom there was a 1.7 per cent decrease.
- Income before tax increased on average for GPs working more than 22.5 hours a week regardless of gender, though the increase was greatest for females within the 22.5 to less than 37.5 hours band, and for males within the 37.5 hours and over band.
- Average total expenses increased for all groups except for males working fewer than 22.5 hours a week.
For earnings and detailed expenses breakdowns for contractor GPs in England by weekly working hours, gender and age, see the accompanying Excel Annex 1 (see Resources on the Overview page).
Salaried GPs
- As was the case for contractor GPs, and as would be expected, average income before tax increased for GPMS salaried GPs as their weekly working hours increased.
Table 3.5: GPMS salaried GPs - average earnings and expenses by weekly working hours, England, 2016/17 and 2017/18
- Within all three weekly hours bands, on average male salaried GPs earned more income before tax and received more in expenses than their female counterparts.
Table 3.6: GPMS salaried GPs - average earnings and expenses by weekly working hours and gender, England, 2016/17 and 2017/18
- As was the case for contractor GPs, male salaried GPs working fewer than 22.5 hours were the only group whose average income before tax decreased between 2016/17 and 2017/18. In contrast, female salaried GPs in this lowest weekly hours band had the greatest percentage increase in income before tax of any weekly hours by gender group.
- Within each of the two higher weekly hours bands, male GPs had bigger increases in income before tax than females.
- All groups of salaried GPs working fewer than 37.5 hours had an increase in total expenses, though the differences were larger for males. The largest percentage changes came in the 37.5 hours and over band, where average total expenses increased by 78.1 per cent, or £11,100, for males while decreasing by 19.1 per cent, or £2,700, for females.
For earnings and expenses estimates for salaried GPs in England by weekly working hours, gender and age, see the accompanying Excel Annex 1 (see Resources on the Overview page).
Last edited: 23 April 2025 12:02 pm