Publication, Part of Cancer registrations statistics, England
Cancer Registration Statistics, England, 2024
National statistics, Accredited official statistics

Cancer incidence by stage
Stage at diagnosis is a measure of the anatomical extent of a cancer when diagnosed. For solid tumours, a higher stage number means the cancer has extended further. As a cancer progresses through the stages of diseases, there are often fewer treatment options. Earlier diagnosis, when cancers are diagnosed at stage 1 and 2 as opposed to stage 3 and 4, is associated with better prognosis on average. It is important to note that not all cancers have a staging system; for example, there is no staging system for most brain cancers. Also, stage information is not currently available for BCCs and cSCCs of skin due to the largely auto-processed registration of these cancers. More information on stage at diagnosis is in the methodology update document.
This commentary discusses the cancer incidence by stage of a subset of cancer groups. Cancer groups are included if:
-
the cancer group is one of the 25 most common cancer groups within a given gender,
-
over 70% of the cancers within the group are stageable, and
-
stage completeness for the group is at least 70%.
Blood cancers (haematological neoplasms), and Head and neck cancers are excluded as cancers within these groups have different staging systems.
In this commentary, stage 1, 2, and ‘Staged – other early’ are considered as ‘stage 1 and 2’, whereas stage 3, 4, and ‘Staged – other advanced’ are considered as ‘stage 3 and 4’.
For a complete breakdown of all stages (stage 1, 2, 3, 4, ‘Staged – other early’, ‘Staged – other advanced’, Unstageable, and Missing) and data for all cancer groups please see Table 1 of the Cancer registration statistics data tables, which can be found on the Overview page of this publication.
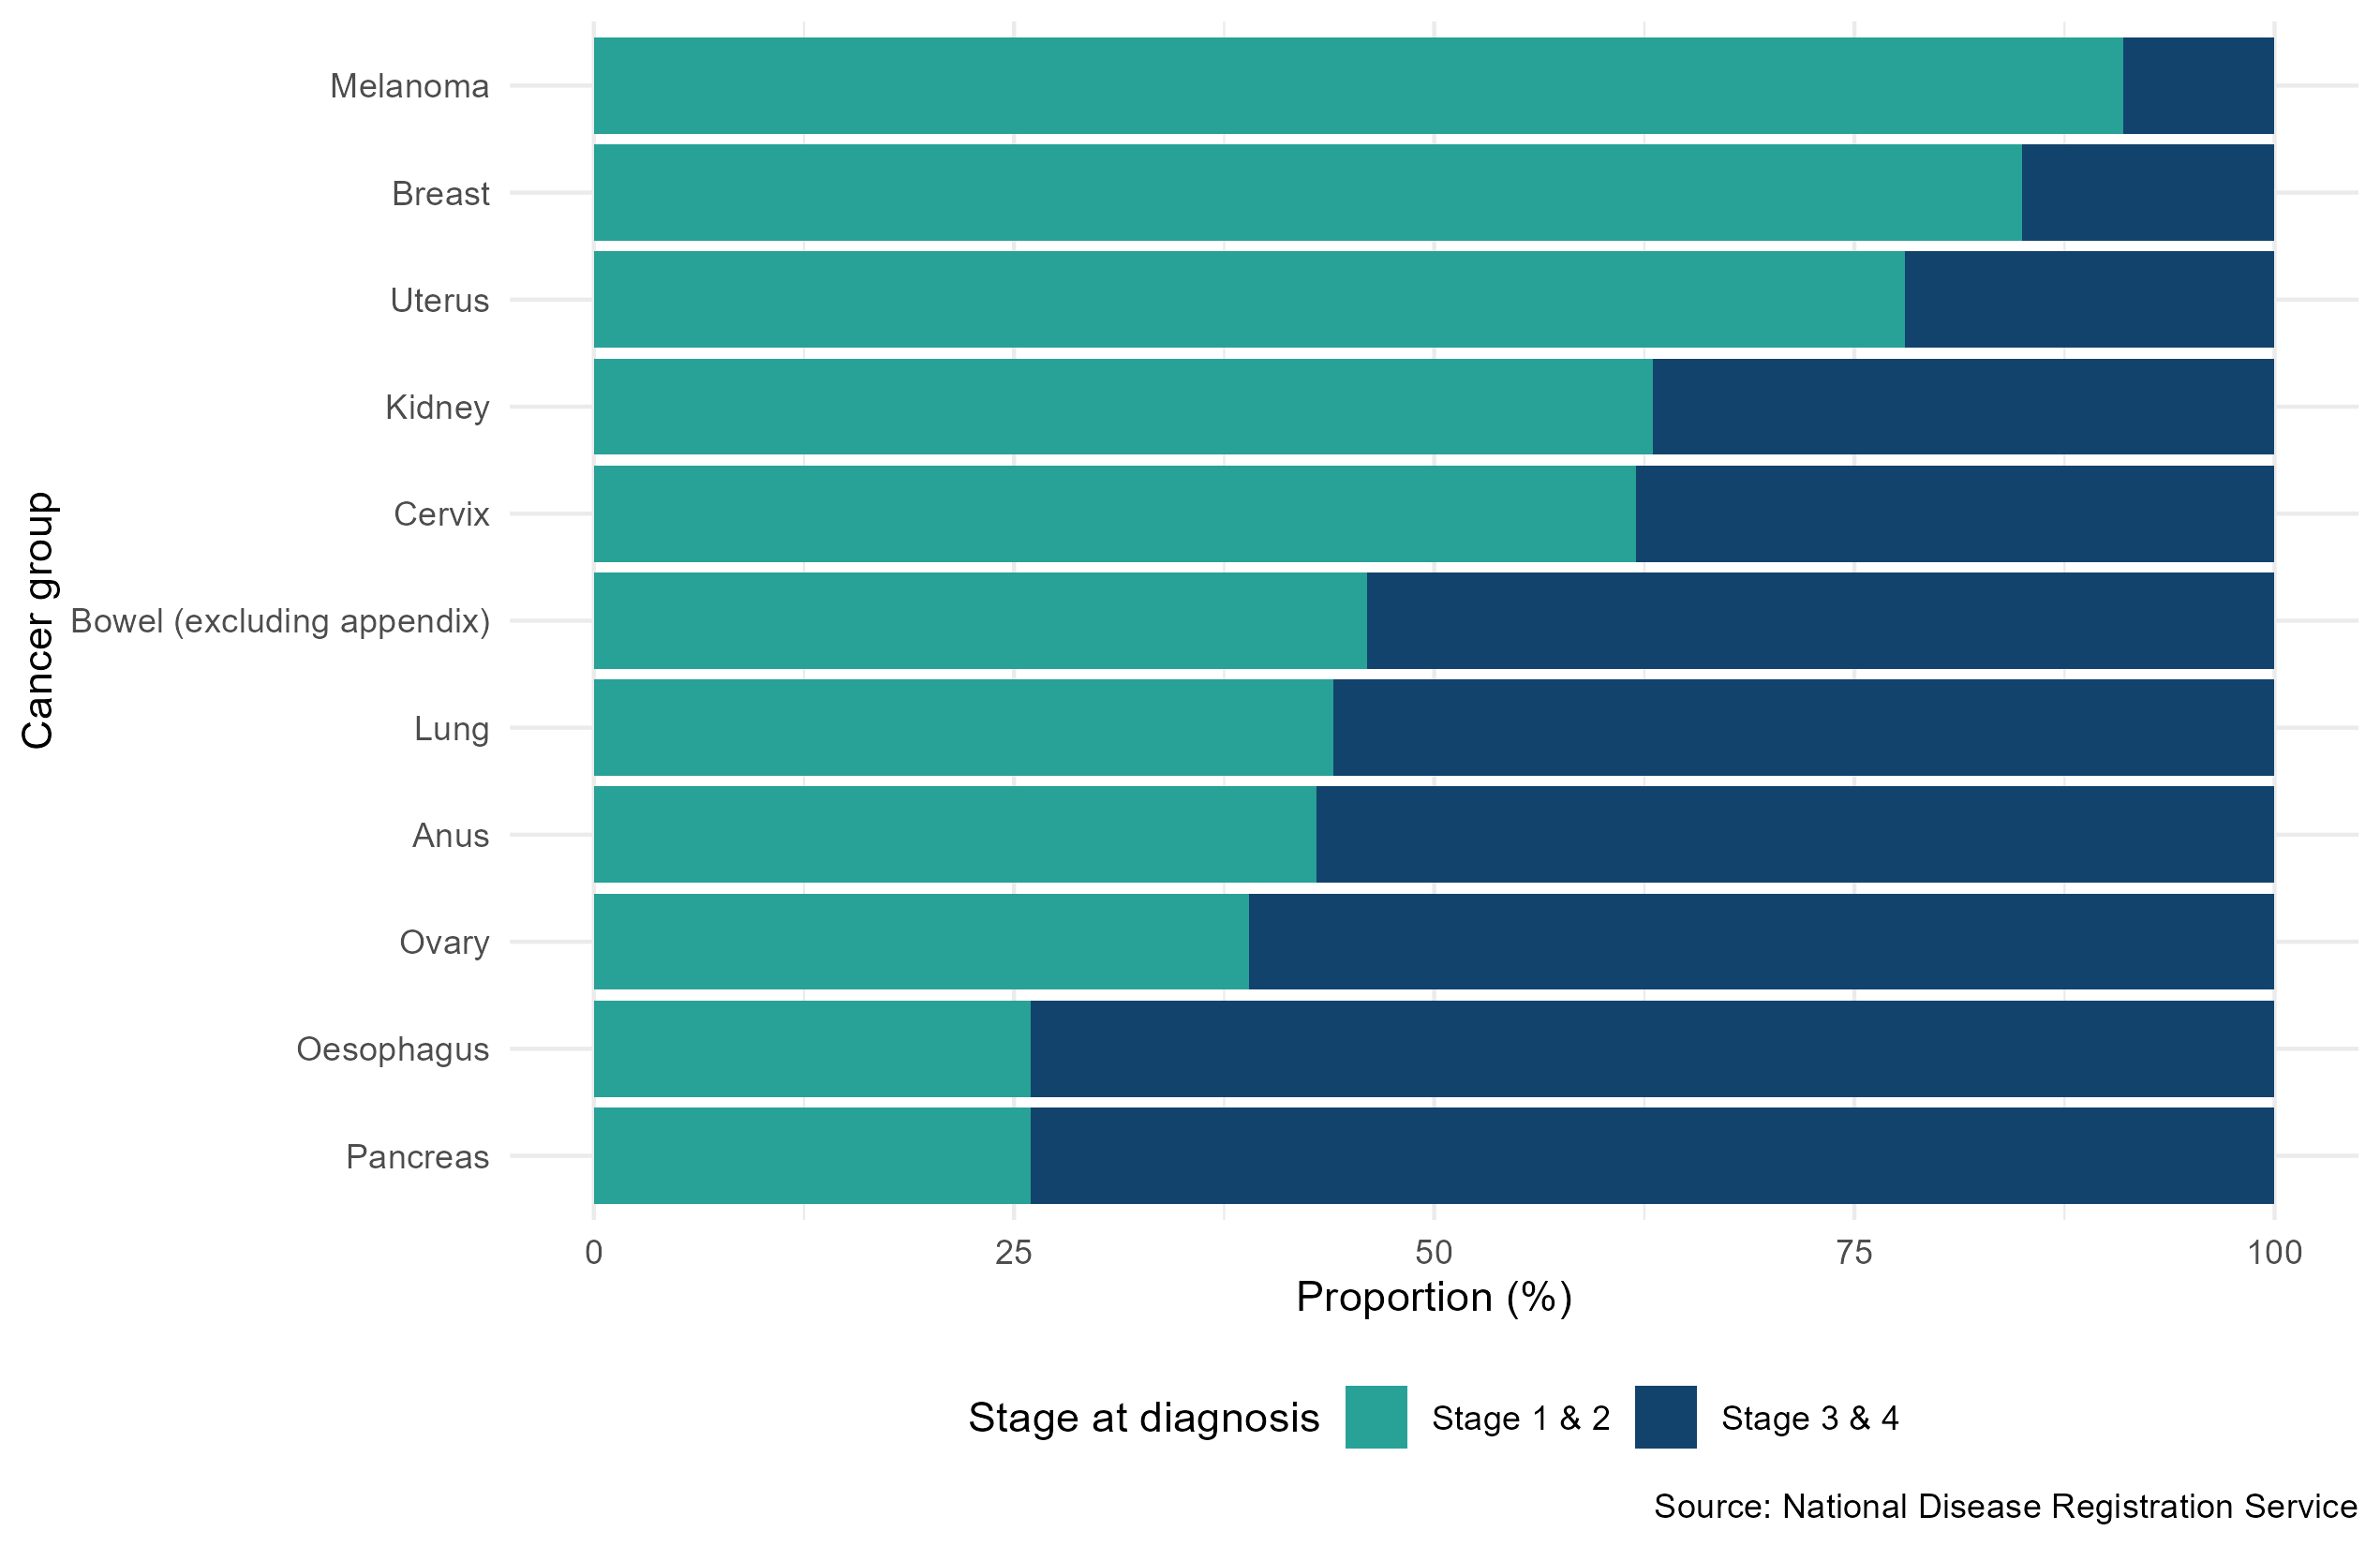
Figures 7 and 8 show the percentage of cancers, of the 25 most common cancers, diagnosed at stage 1 and 2, and stage 3 and 4, out of all staged cancers diagnoses (diagnoses that are unstageable or have missing stage information are not included in the denominator of the estimates) for males and females, respectively. For males, cancer of the Testes had the highest percentage of diagnoses at stage 1 and 2 (90%), whilst Melanoma had the second highest percentage (87%). For females, Melanoma had the highest percentage of diagnoses at stage 1 and 2 (91%), whilst Breast cancer had the second highest percentage (85%).
Figure 7: Percentage of staged cancers diagnosed for males by stage at diagnosis (stage 1 & 2 and stage 3 & 4) for selected cancer groups, England, 2024
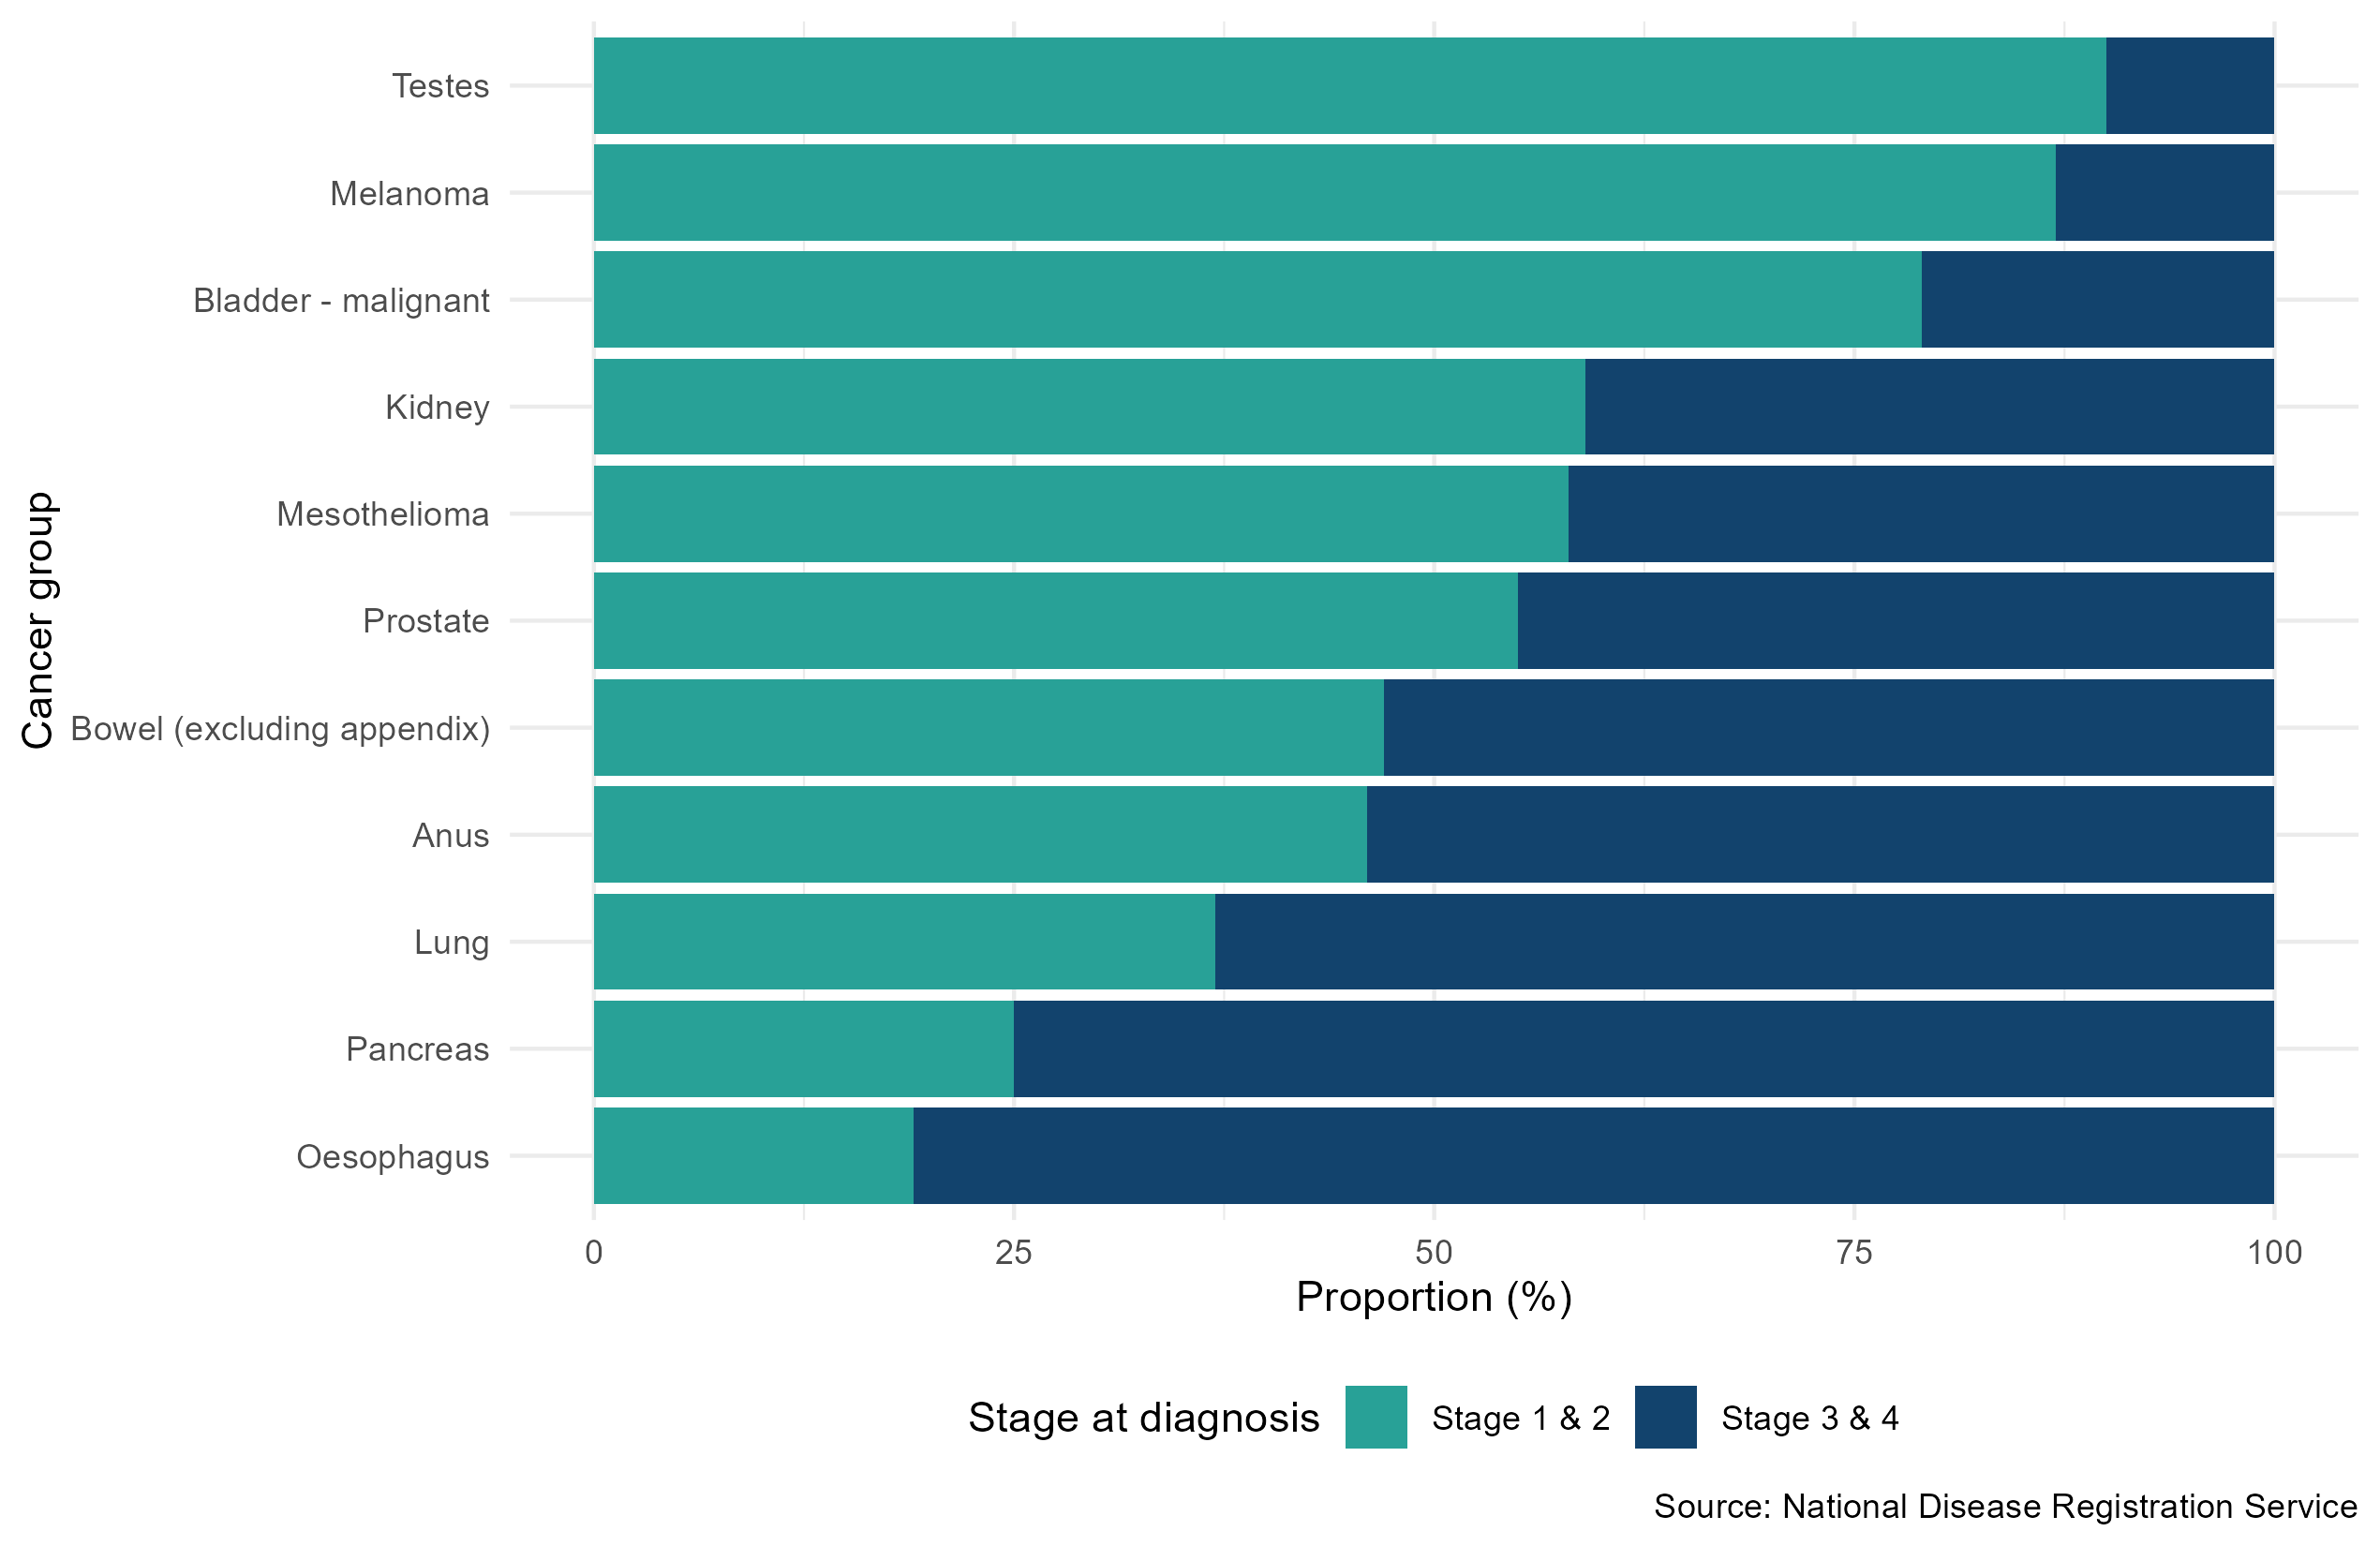
Figure 8: Percentage of staged cancers diagnosed for females by stage at diagnosis (stage 1 & 2 and stage 3 & 4) for selected cancer groups, England, 2024
Last edited: 5 November 2026 9:31 am