Publication, Part of NCARDRS Congenital Condition Statistics: Annual Data
NCARDRS Congenital Condition Official Statistics Report, 2023
Official statistics
Updated and restated counts and birth prevalence estimates (2018 - 2022)
This year, five additional data tables have been included in the data table collection. These tables update the counts and birth prevalence estimates for previous years to provide more current data. NCARDRS has no upper age limit for congenital condition registration and data can accumulate over time as diagnoses are confirmed later in childhood and new data sources are acquired. In these formative years of national registration, when a new data source was added to the data collection, every effort was made to back date data collection to the 2018 birth year. The result of this is that counts increased for previous years, changing birth prevalence estimates. In future years, new incoming electronic data will be used from the year in which they are received forwards, and back dated for the previous three birth years only.
The new data tables are:
-
Data table 3a (2018 - 2022) contains counts and total and live birth prevalence for each year since 2018 by individual congenital condition and congenital condition groupings for England.
-
Data table 3b (2018 - 2022) contains the same data aggregated by region.
-
Data table 3c (2018 - 2022) contains the same data aggregated by ICB.
-
Data table 4a presents information on pregnancy outcome for babies with congenital conditions by region and by birth year: percentages with 95% confidence intervals (CI), in England, birth years 2018 - 2022.
-
Data table 4b presents information on pregnancy outcome for babies with at least one trisomy of Down's syndrome (T21), Edwards' syndrome (T18), or Patau's syndrome (T13) by region and by birth year: percentages with 95% confidence intervals (CI), in England, birth years 2018 - 2022.
Impact of additional data on counts and rates
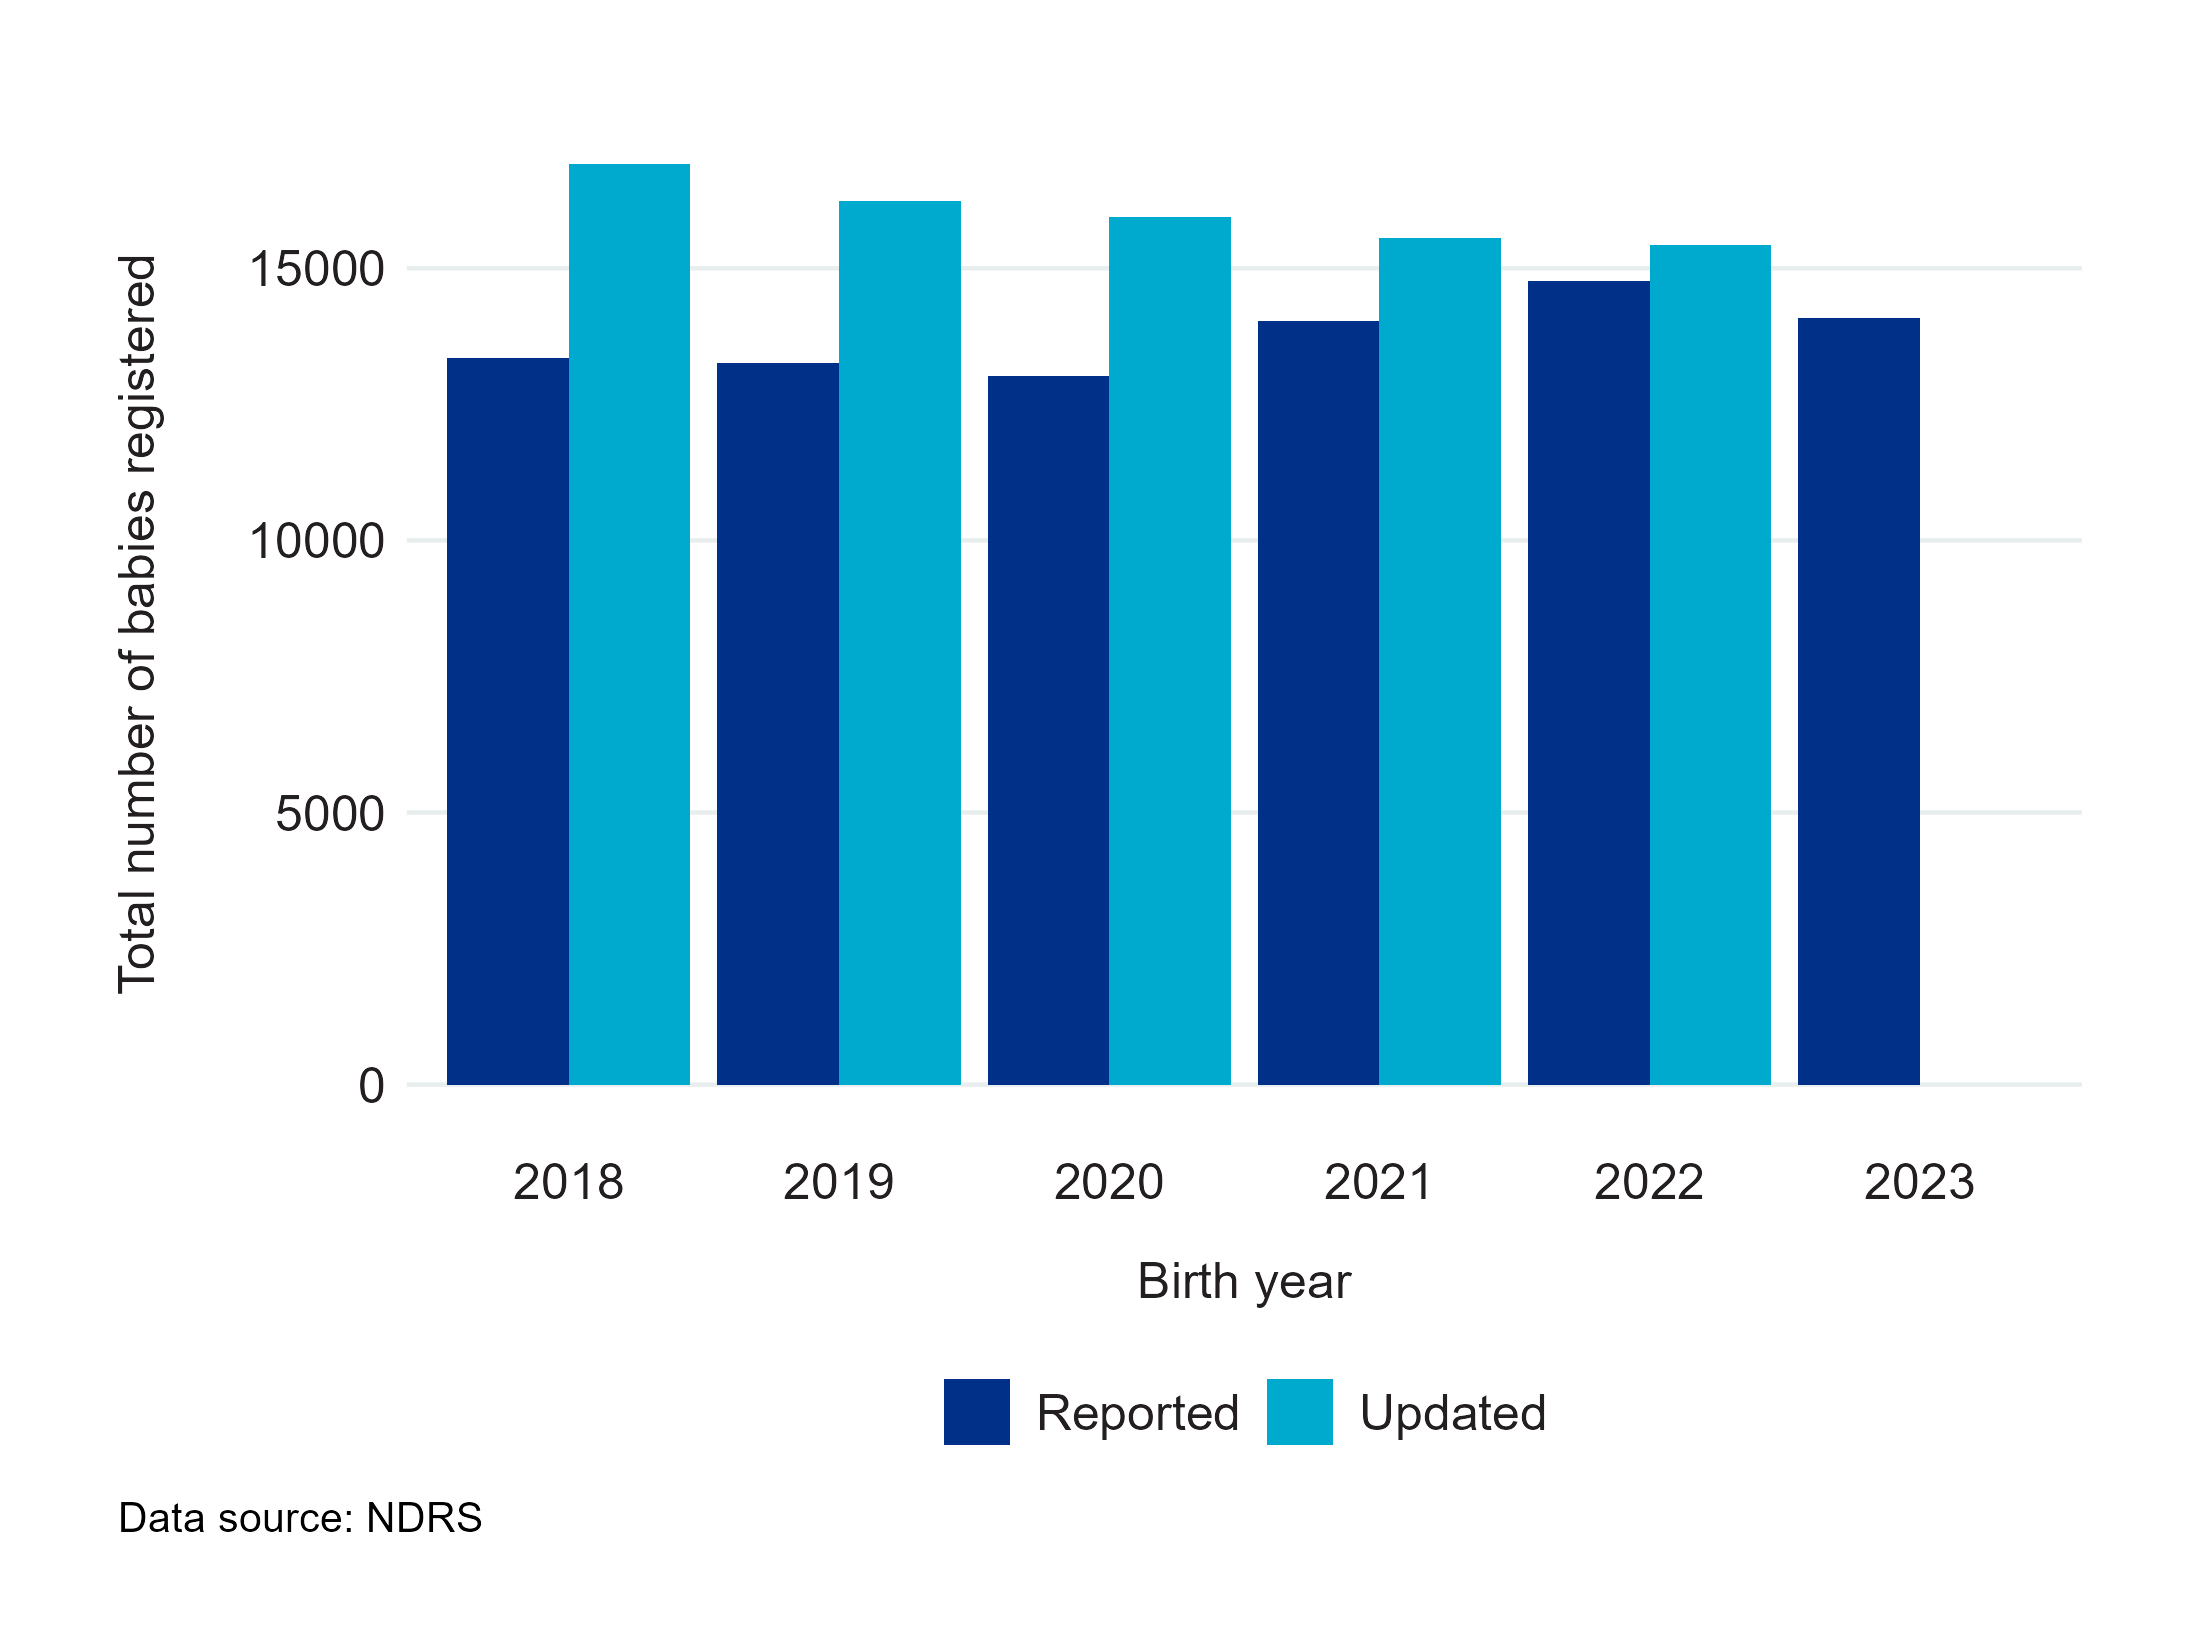
As of 1 June 2026, an additional 3,514 (26.7%) babies with a congenital condition had been added to the 2018 birth cohort, 7.5 years after the last date of delivery in that cohort, representing an increase of 26.7% from the figures originally reported for this birth year (see Table B). The change in numbers of babies in each birth year fell as they got closer to the most recent year, but a further 4.5% had been added to the 2022 birth year cohort since data was last published by NDRS.
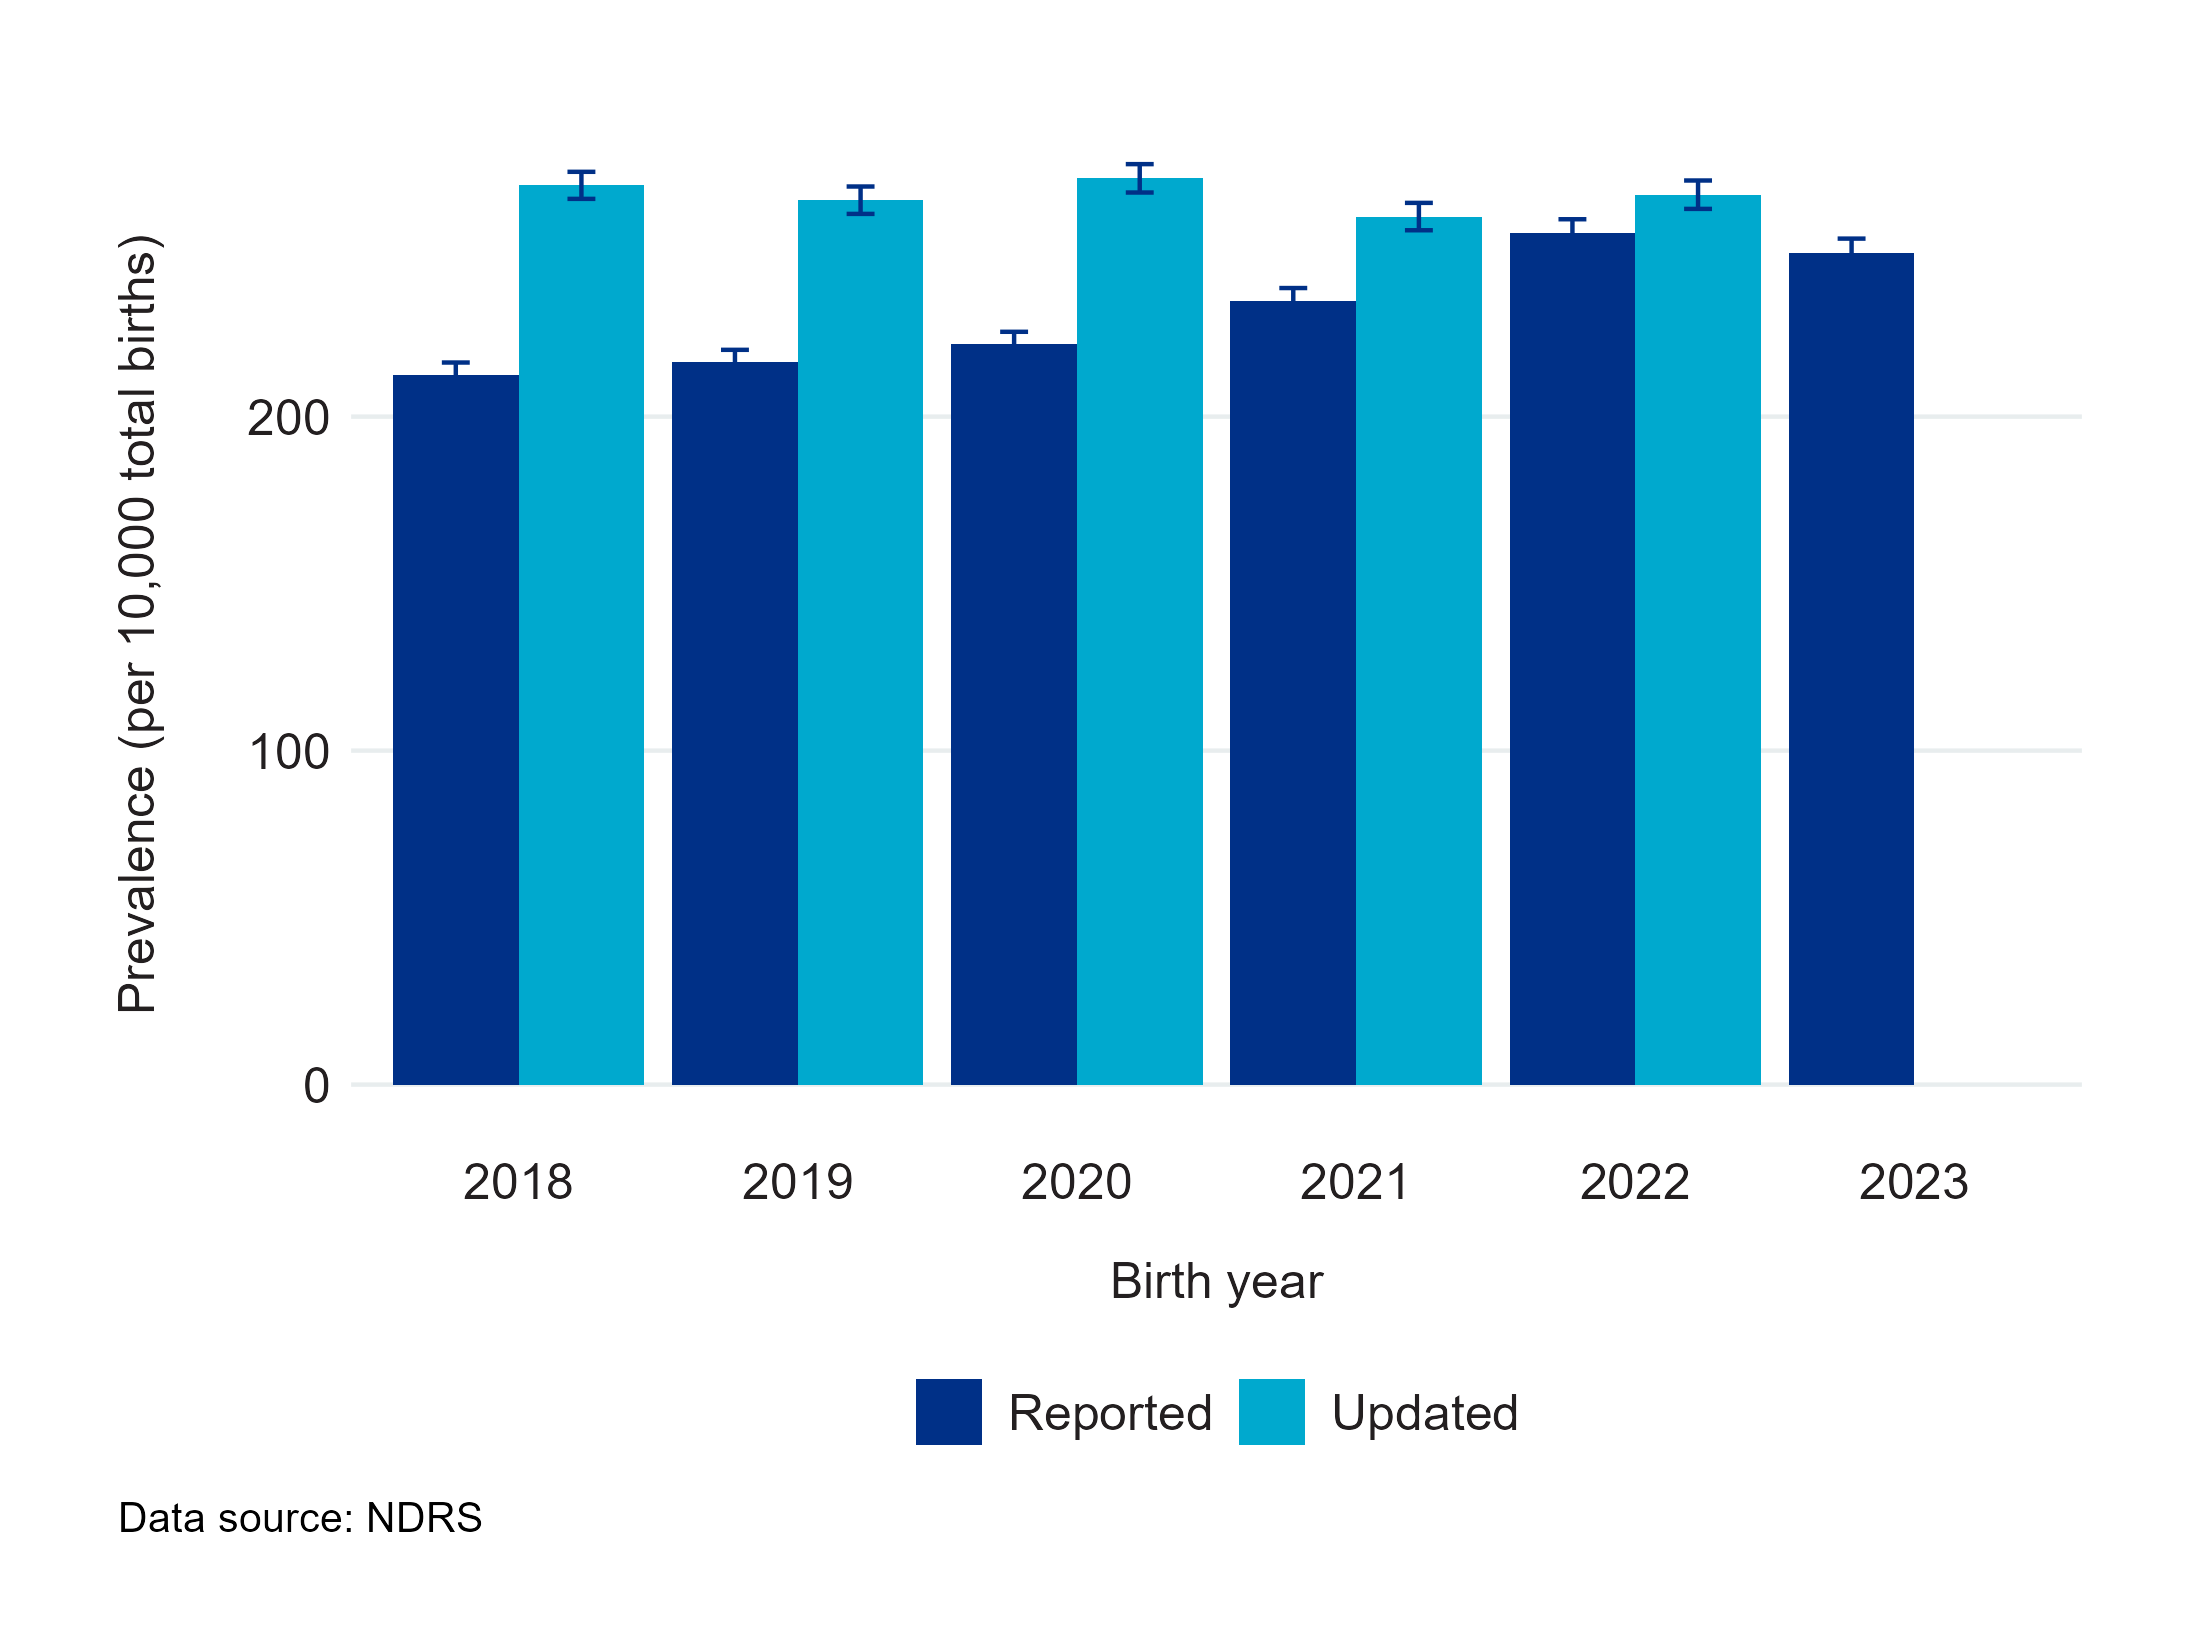
Total birth prevalence increased by a similar proportion, with rates for 2018 now 26.3% higher than originally reported and the impact declining in the more recent cohorts. Total birth prevalence for the 2022 cohort is 4.5% higher than it was at initial reporting, one year ago. The 2023 birth cohort is included for comparison but currently contains only the initially reported figures and has not yet benefited from the same level of additional case ascertainment seen in earlier cohorts.
The impact of this accumulated data is likely not uniformly spread across condition types. A more detailed analysis of the longitudinal trend and the impact of accumulated data on reported prevalence estimates will be presented in a future publication.
Figures 4 and 5 illustrate the differences between initially reported and updated numbers and total birth prevalence estimates for babies with a congenital condition in England.
Reported and updated counts and percentages: pregnancy outcome
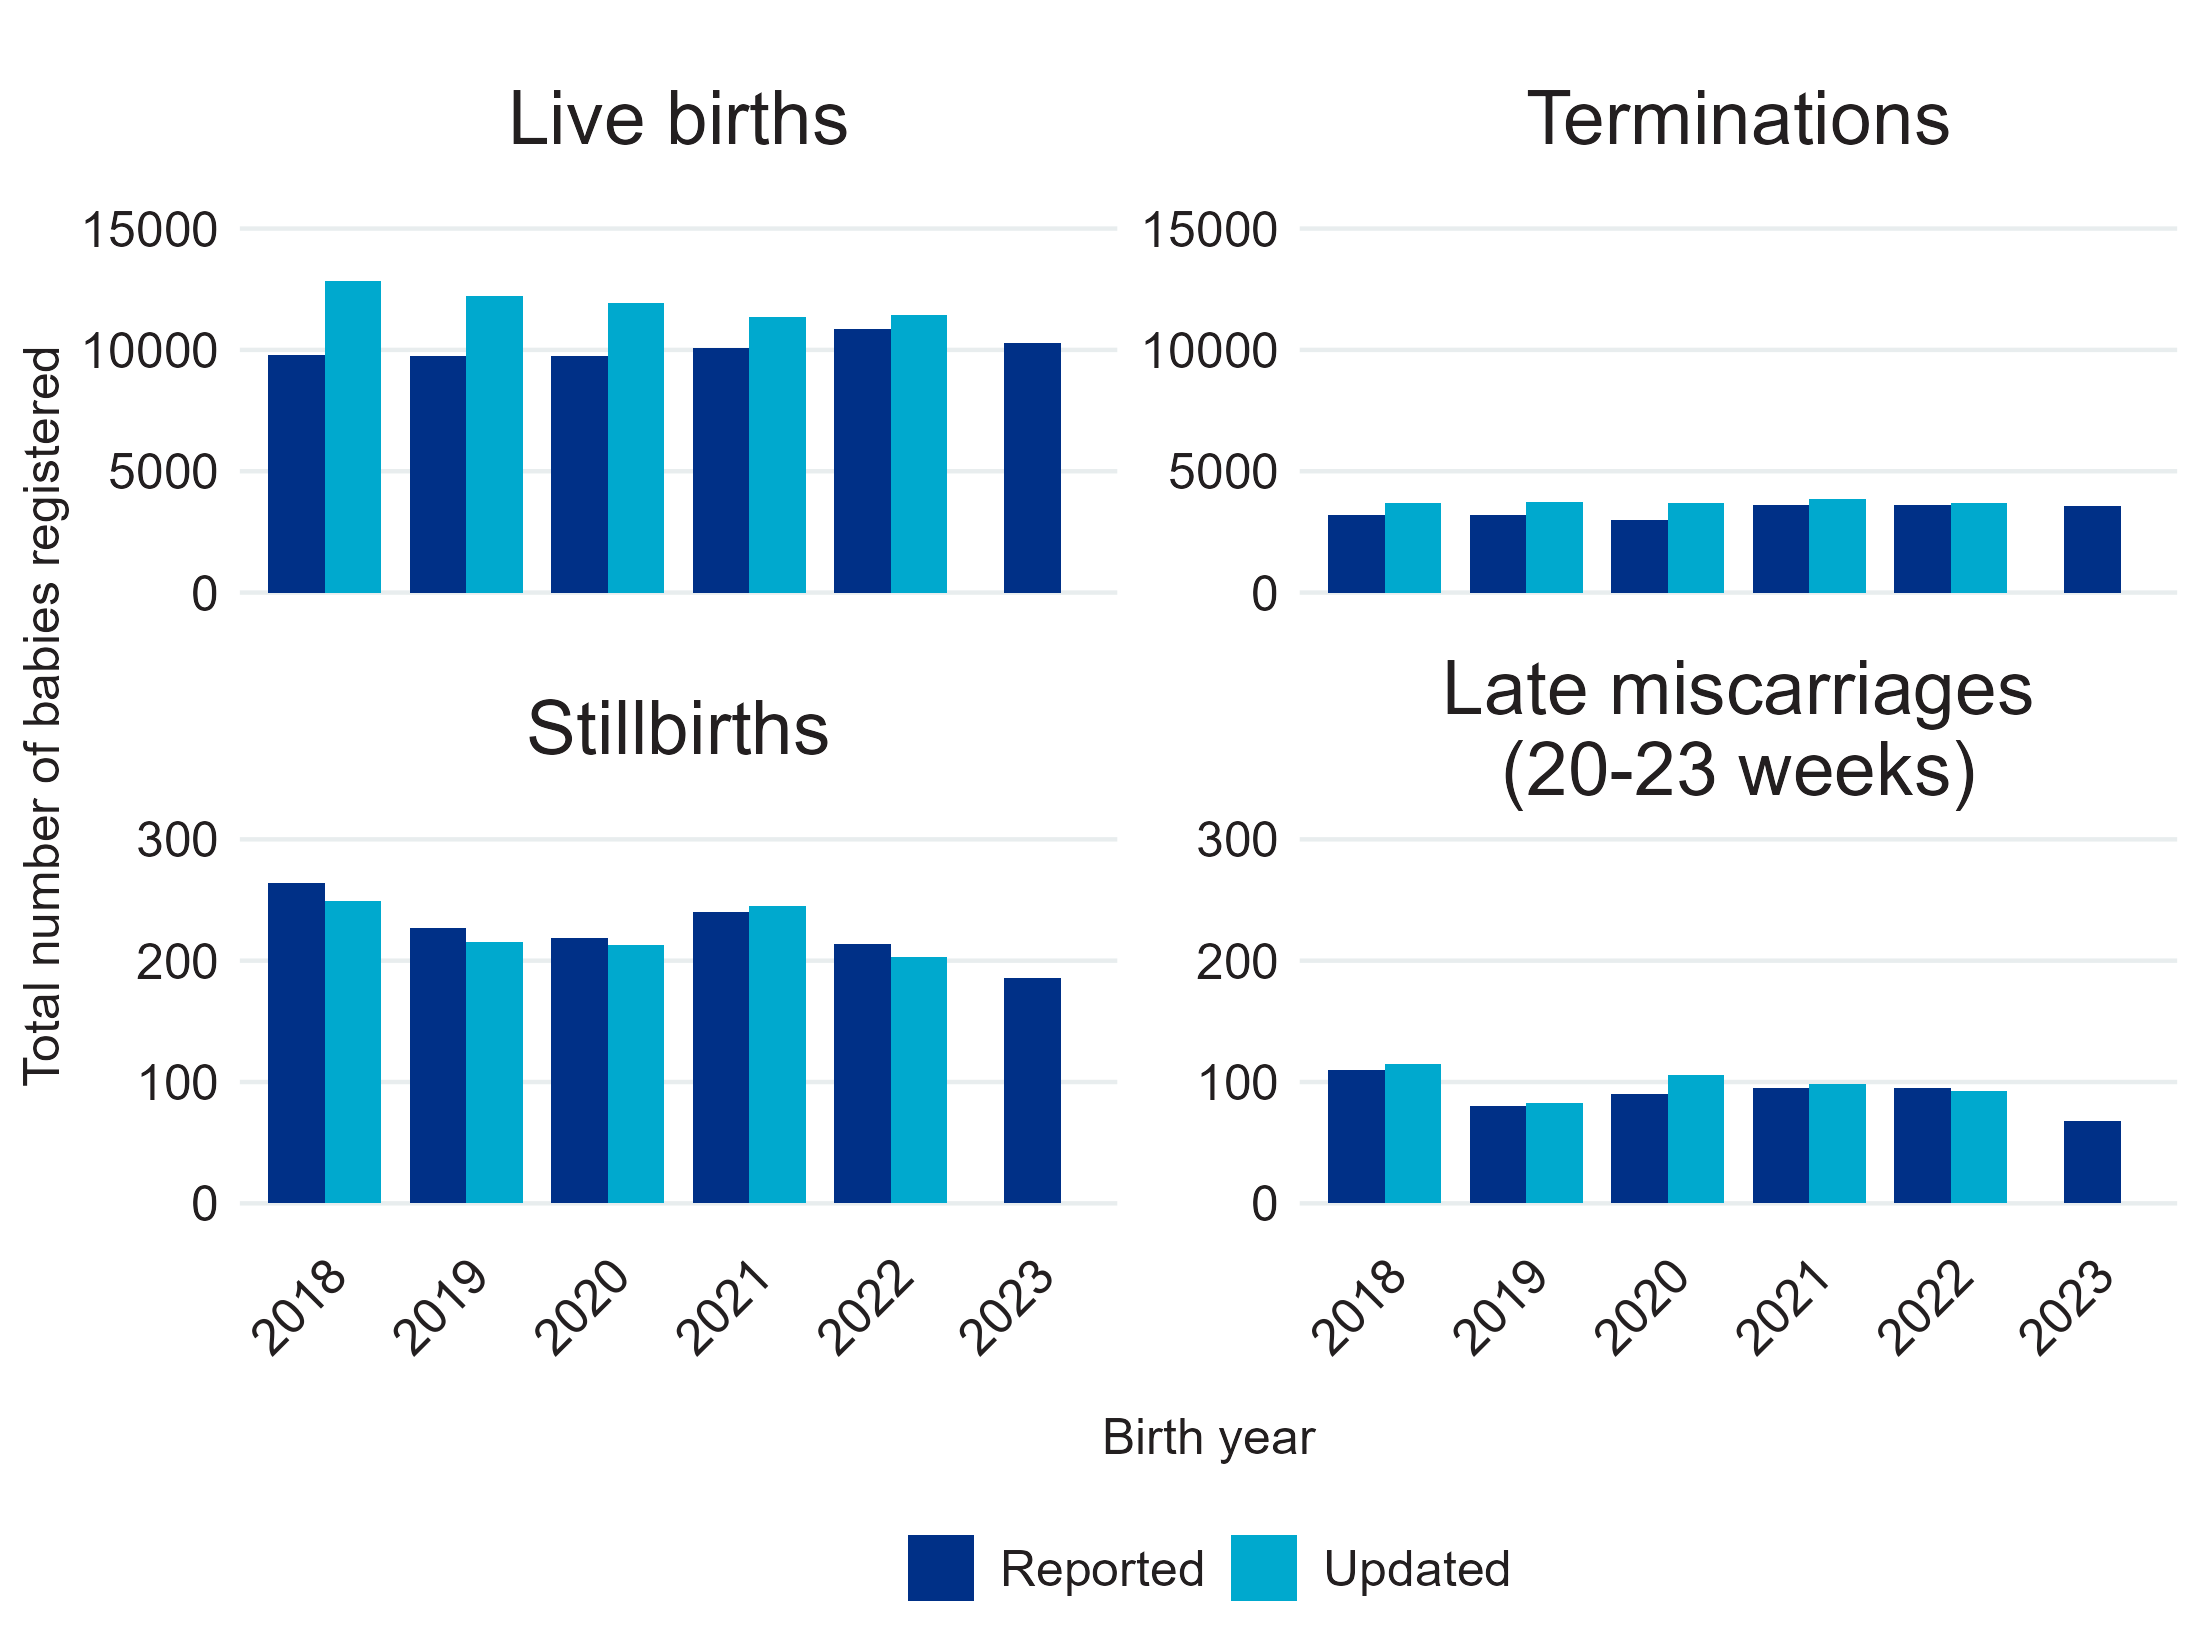
Comparison of reported and updated counts for birth years 2018 - 2022 showed that the largest increase was observed for the number of live births (see Figure 6), where counts increased by 9,580 cases in total, while counts for terminations, stillbirths, late miscarriages and not known birth outcome changed only marginally.
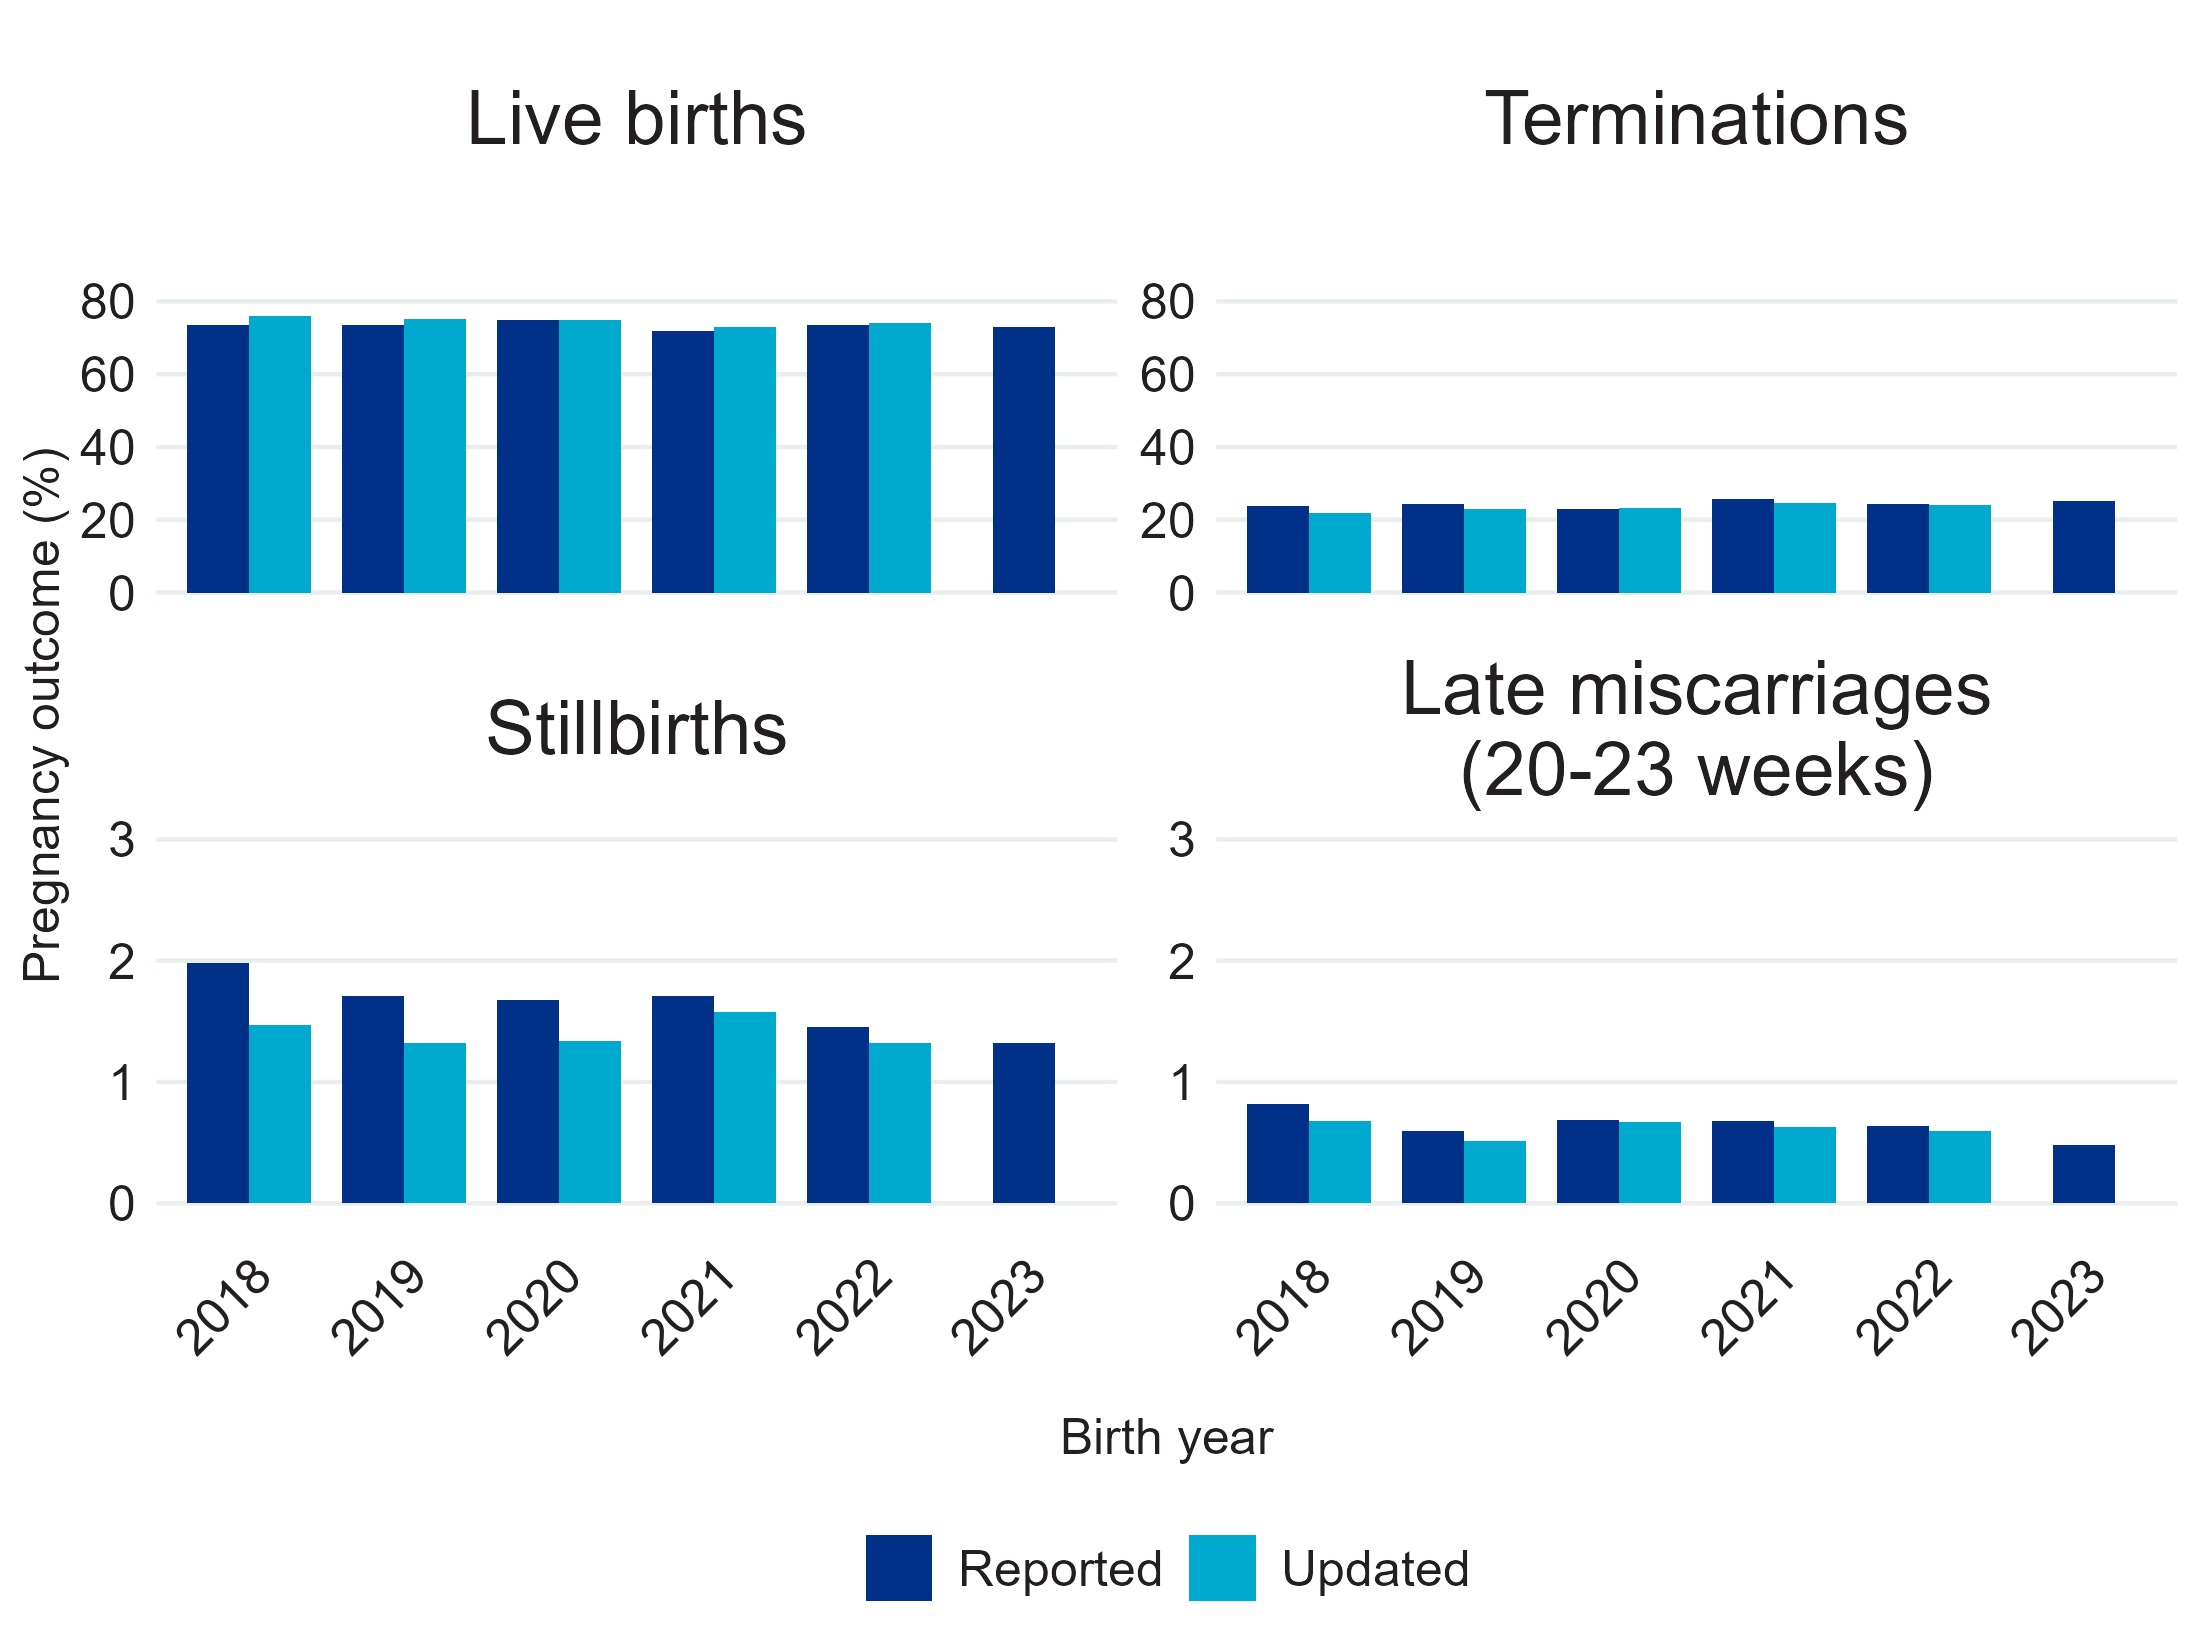
Across all birth years, Figure 7 shows that live births accounted for the majority of babies with congenital conditions, representing 71.85-75.96%. Terminations accounted for most of the remaining cases, representing 21.88-25.76%, while stillbirths, late miscarriages made up only a very small proportion. The distribution of pregnancy outcomes was broadly similar in the counts initially reported to the updated counts, although the proportion of terminations was consistently slightly lower over the years which corresponds to the increase in the proportion of live births.
Last edited: 5 November 2026 9:31 am