Publication, Part of NCARDRS Congenital Condition Statistics: Annual Data
NCARDRS Congenital Condition Official Statistics Report, 2023
Official statistics
Total birth prevalence of major congenital condition groups, by region
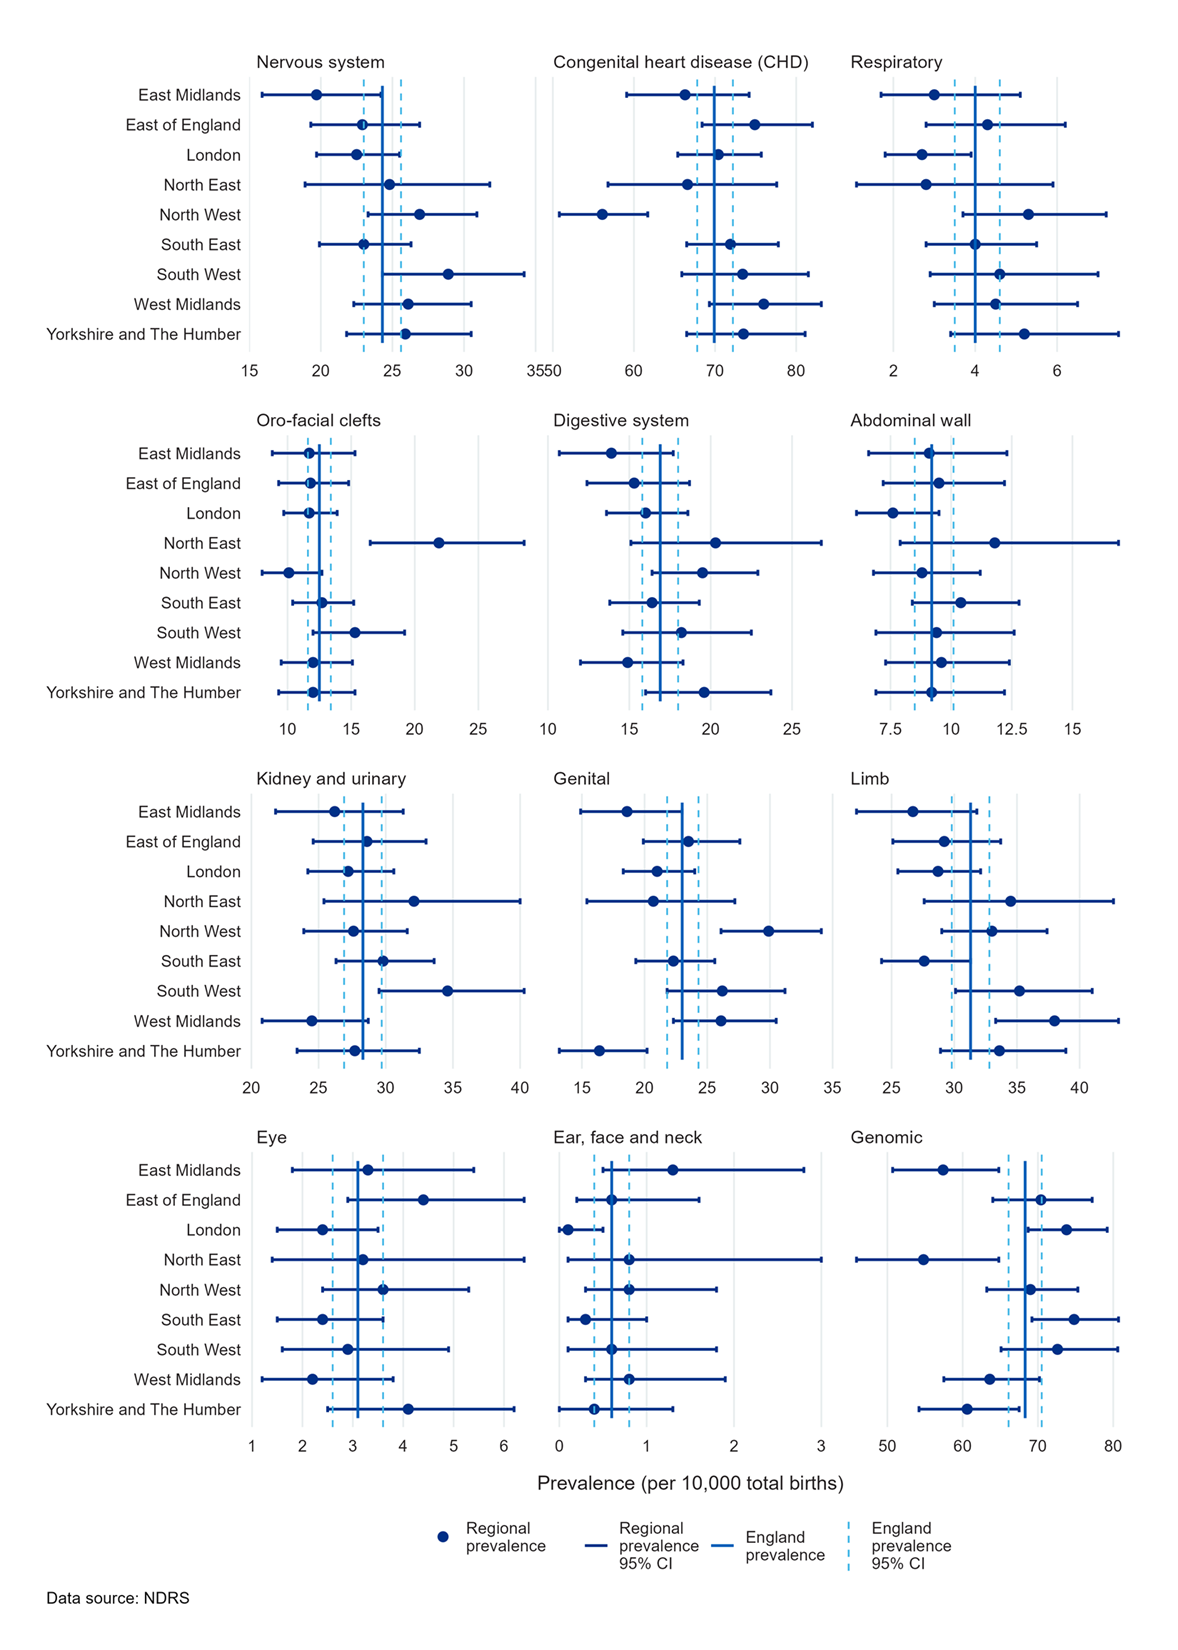
Figure 2b presents the counts and prevalence of babies with a condition by region and by major congenital condition group. Further regional breakdowns by major condition group, condition subgroup and individual congenital condition are available in Data table 1b.
Differences across regions were assessed statistically, as described in the Technical Details. Only statistically significant differences are reported, unless explicitly stated otherwise. All regions were compared to London as it is the region with the highest birth population.
For most congenital condition groups, birth prevalence in 2023 was relatively consistent across regions, although significant regional variation was observed for CHD, oro-facial cleft, genital, limb and genomic conditions.
CHD prevalence was significantly lower in the North West compared to London, although consistent across all other regions. The birth prevalence of limb conditions was significantly higher in the West Midlands and the South West than in London.
The number and prevalence of oro-facial clefts in the North East was significantly higher than in London. The birth prevalence for each of the other regions were consistent with London. The North East is smaller than the other English regions with one centralised cleft service and comprehensive data flows into NDRS.
Genital conditions also showed variation between regions, with higher prevalence in the North West and West Midlands compared to London.
Genomic condition prevalence was significantly lower than in London for the East Midlands, Yorkshire and Humber, West Midlands and North East.
Regional comparisons should be interpreted with caution for the reasons outlined on Why are there differences across regions, particularly given known variation in ascertainment and data flows across England.
Last edited: 5 November 2026 9:31 am