Publication, Part of NCARDRS Congenital Condition Statistics: Annual Data
NCARDRS Congenital Condition Official Statistics Report, 2023
Official statistics
Total birth prevalence of all congenital conditions, by region
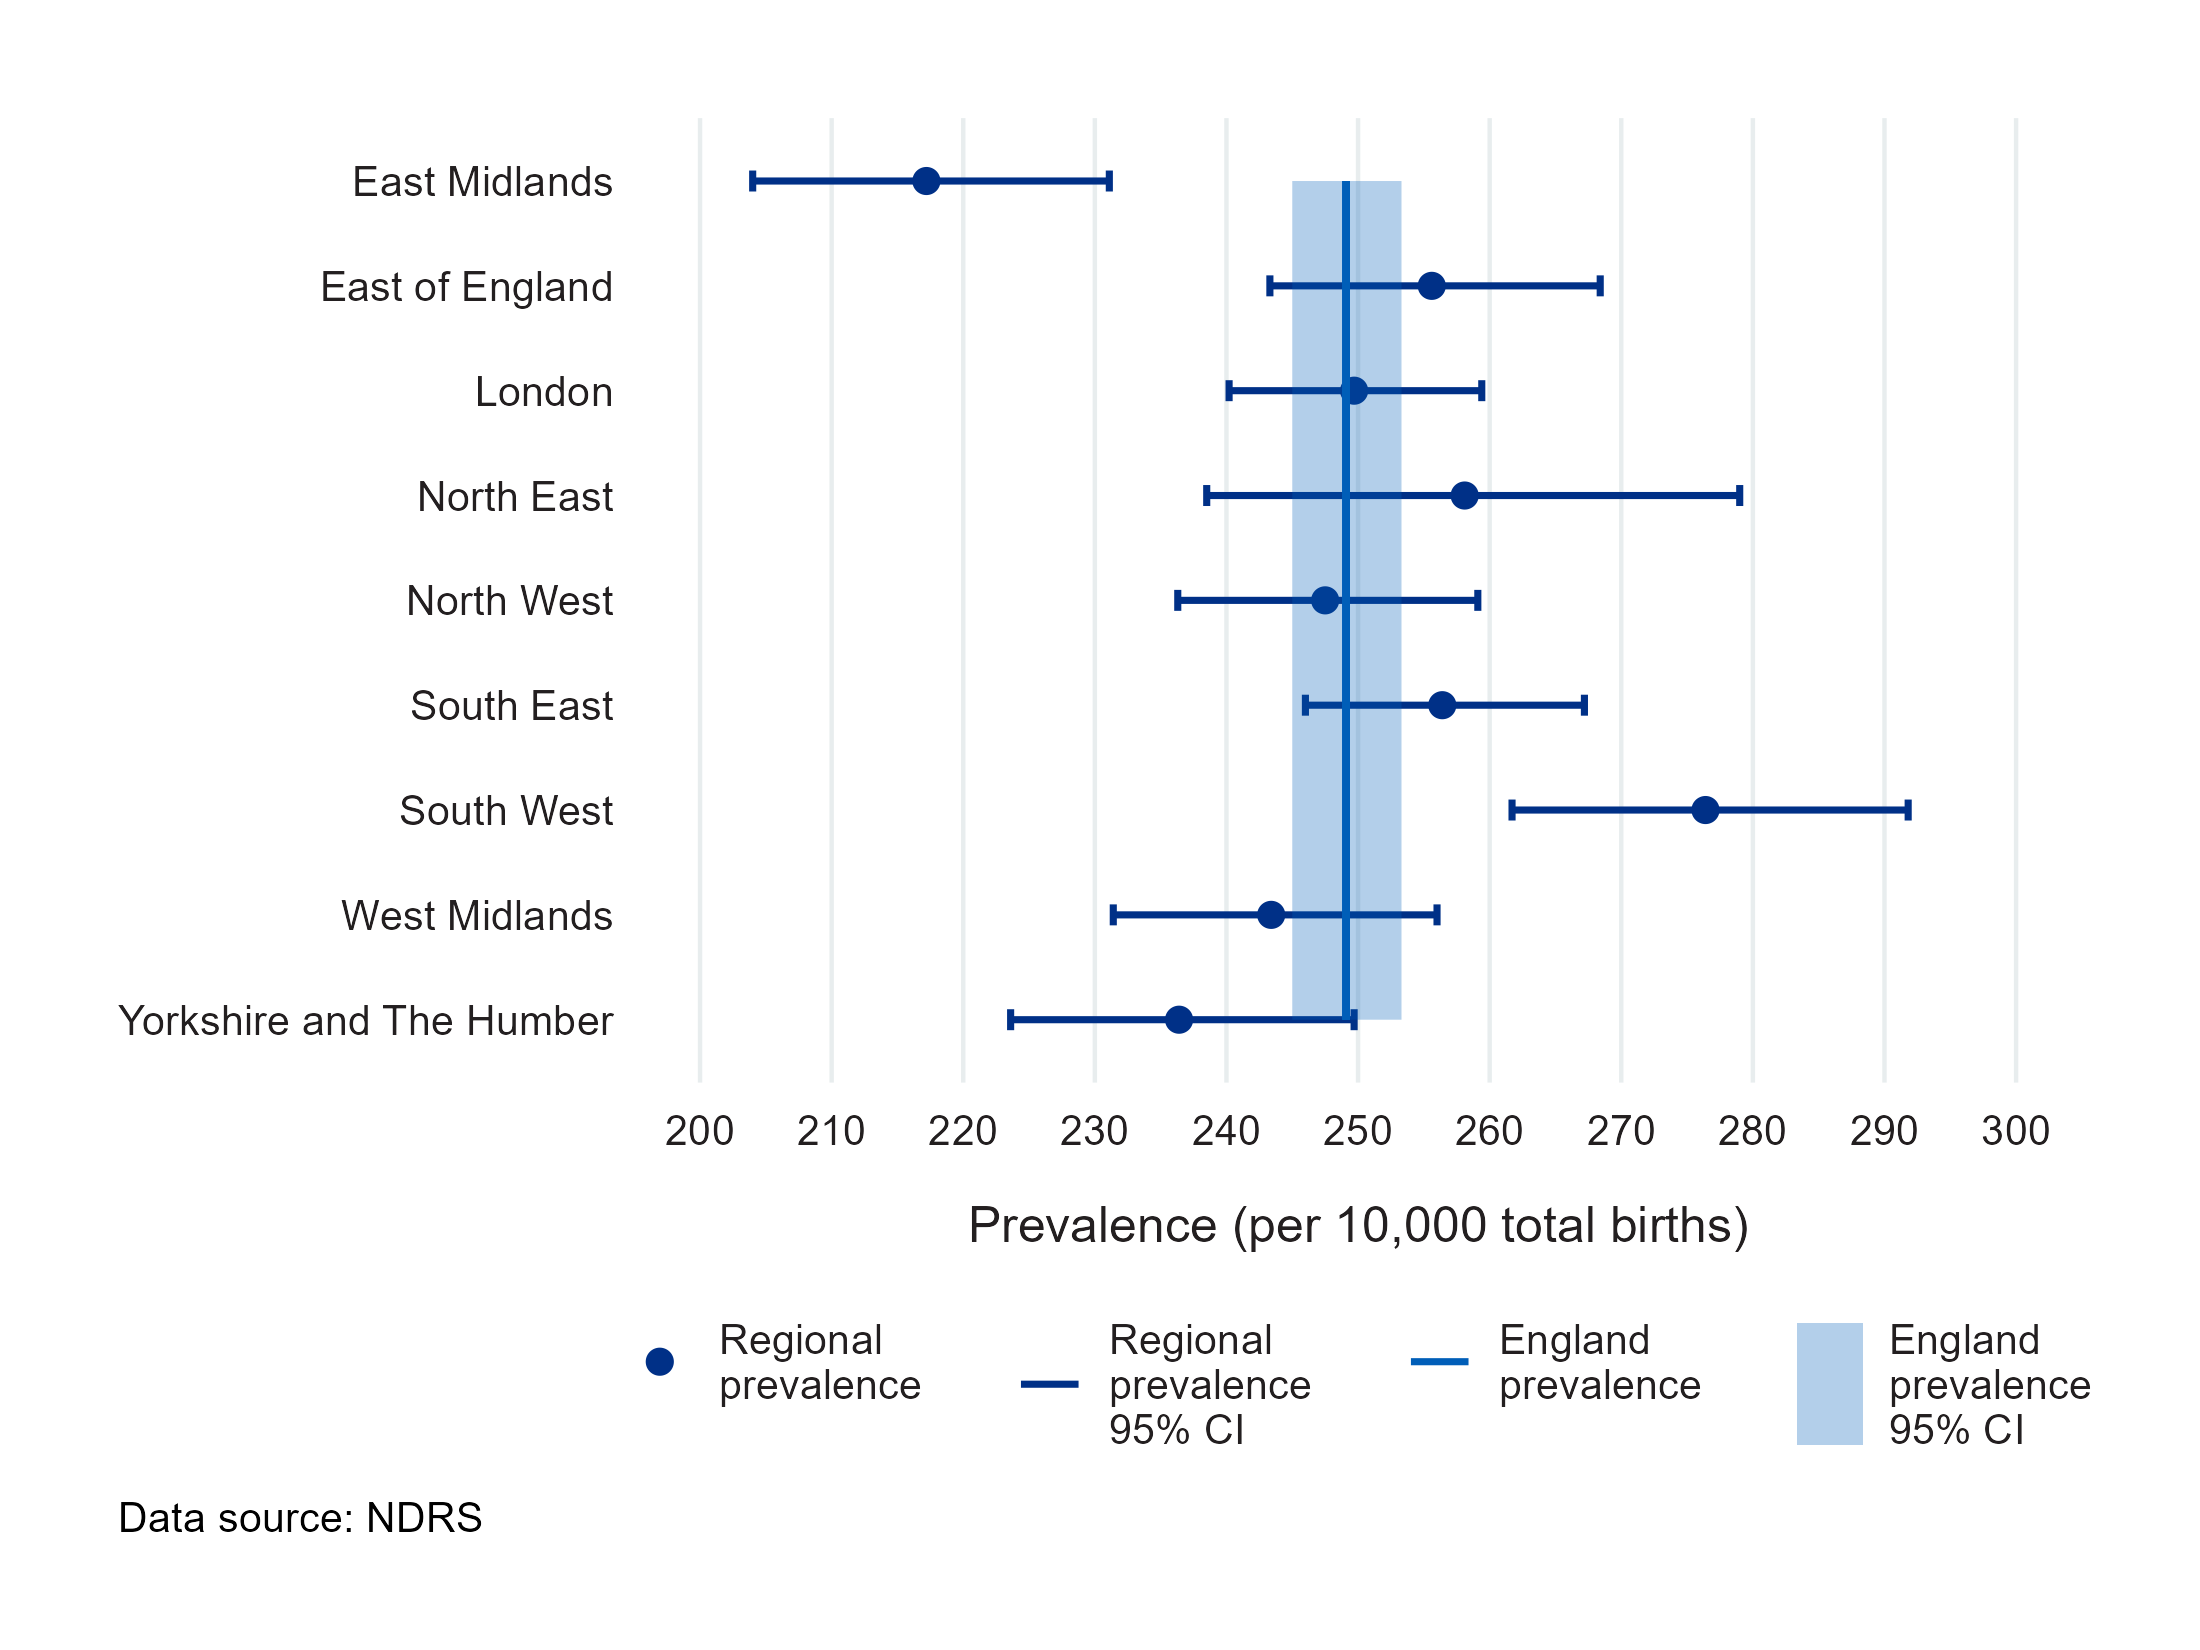
Figure 2a and Data table 1b present total birth prevalence (the number of babies diagnosed with at least one congenital condition per 10,000 total births) in 2023 by region in England. This data is available at a more granular geography, by Integrated Care Board (ICB), in Data table 1c. A full description of regional geographies is available in the Technical Details.
Prevalence per 10,000 total births varied by region, with the highest in the South West region (276.4, 95% CI 261.7-291.8) and lowest in the East Midlands (217.2, 95% CI 204.0-231.1).
Regional comparisons should be interpreted with caution for the reasons outlined on Why are there differences across regions, particularly given known variation in ascertainment and data flows across England.
Last edited: 5 November 2026 9:31 am