Publication, Part of National Child Measurement Programme
National Child Measurement Programme, England, 2021/22 school year
Official statistics, National statistics, Accredited official statistics
Part 4: Deprivation
For NCMP, we provide deprivation data based on both where the child lives and where the child attends school. Deprivation based on where the child lives is more accurate since sometimes children attend schools in areas with different relative deprivation compared to where they live. Consequently, this report uses the deprivation decile of the child postcode to define deprivation for the current year.
Time series comparisons from 2006/07 are provided for deprivation based on where the child attends school and from 2013/14 for deprivation based on where the child lives. This is because there were issues with the quality and completeness of the child postcode in the early years of NCMP.
Reception – prevalence based on deprivation where the child lives
Relationship between deprivation and prevalence of children living with obesity
There is a strong relationship between deprivation and obesity.
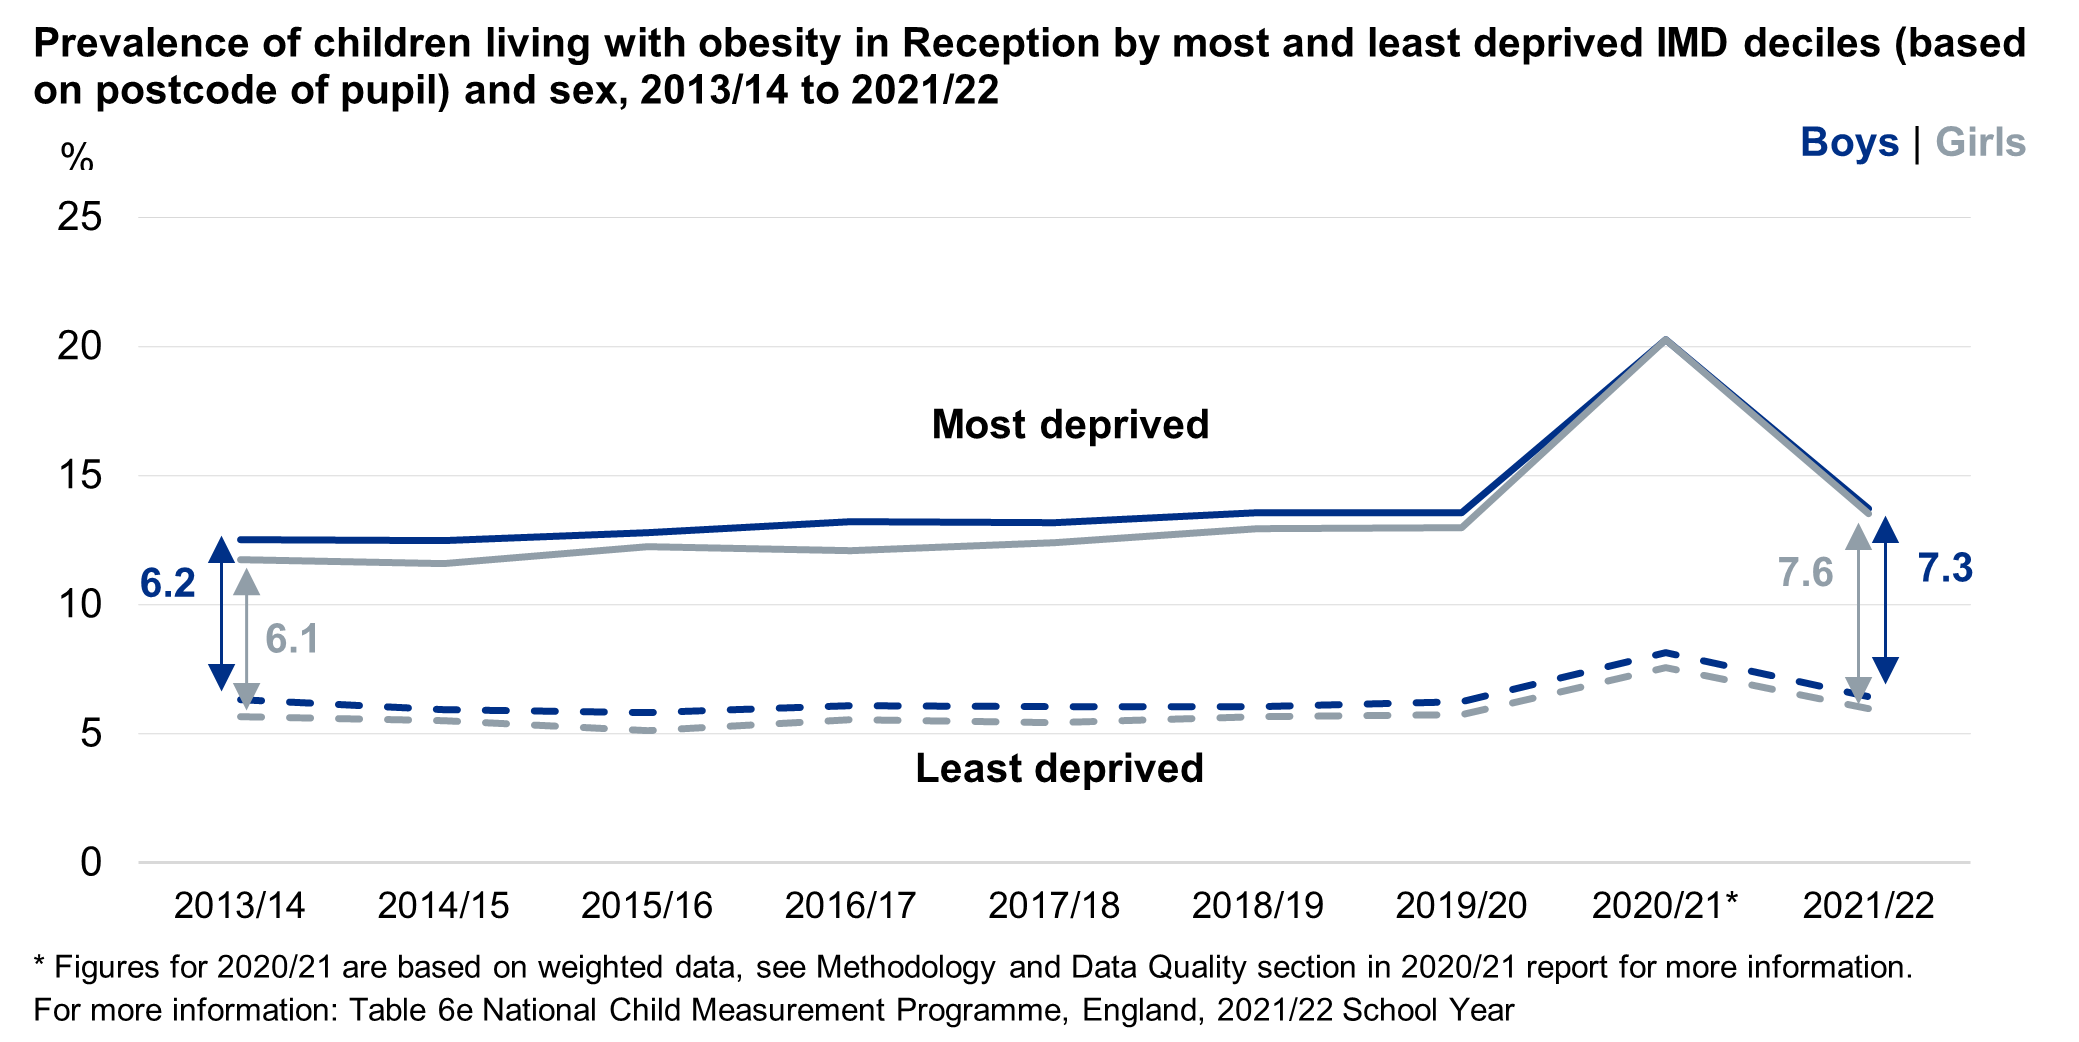
The prevalence of children living with obesity was over twice as high for children living in the most deprived areas (13.6%) than for children living in the least deprived areas (6.2%).
Time series deprivation data for children living with obesity
For children living in the most deprived areas, the prevalence of those living with obesity increased from 12.1% in 2013/14 to 20.3% in 2020/21, the main year of the Covid-19 pandemic. This decreased to 13.6% in 2021/22, which is still higher than pre-pandemic levels.
For children living in the least deprived areas, the prevalence of those living with obesity was similar in 2013/14 (6.0%) and in 2021/22 (6.2%). There was an increase in prevalence of those living with obesity in 2020/21 (7.8%) during the main year of the Covid-19 pandemic.
The deprivation gap between children living in the most and least deprived areas increased by 1.3 percentage points between 2013/14 and 2021/22 due to the prevalence of children living with obesity increasing in the most deprived areas and remaining similar in the least deprived.

For children living in the most deprived areas, the prevalence of those living with obesity increased in girls from 11.8% in 2013/14 to 13.5% in 2021/22 and for boys from 12.5% in 2013/14 to 13.7% in 2021/22.
For children living in the least deprived areas, the prevalence of children living with obesity was similar for both boys and girls between 2013/14 and 2021/22.
Overall, the increase in the deprivation gap over time was similar for boys and girls.
Relationship between deprivation and prevalence of children living with severe obesity
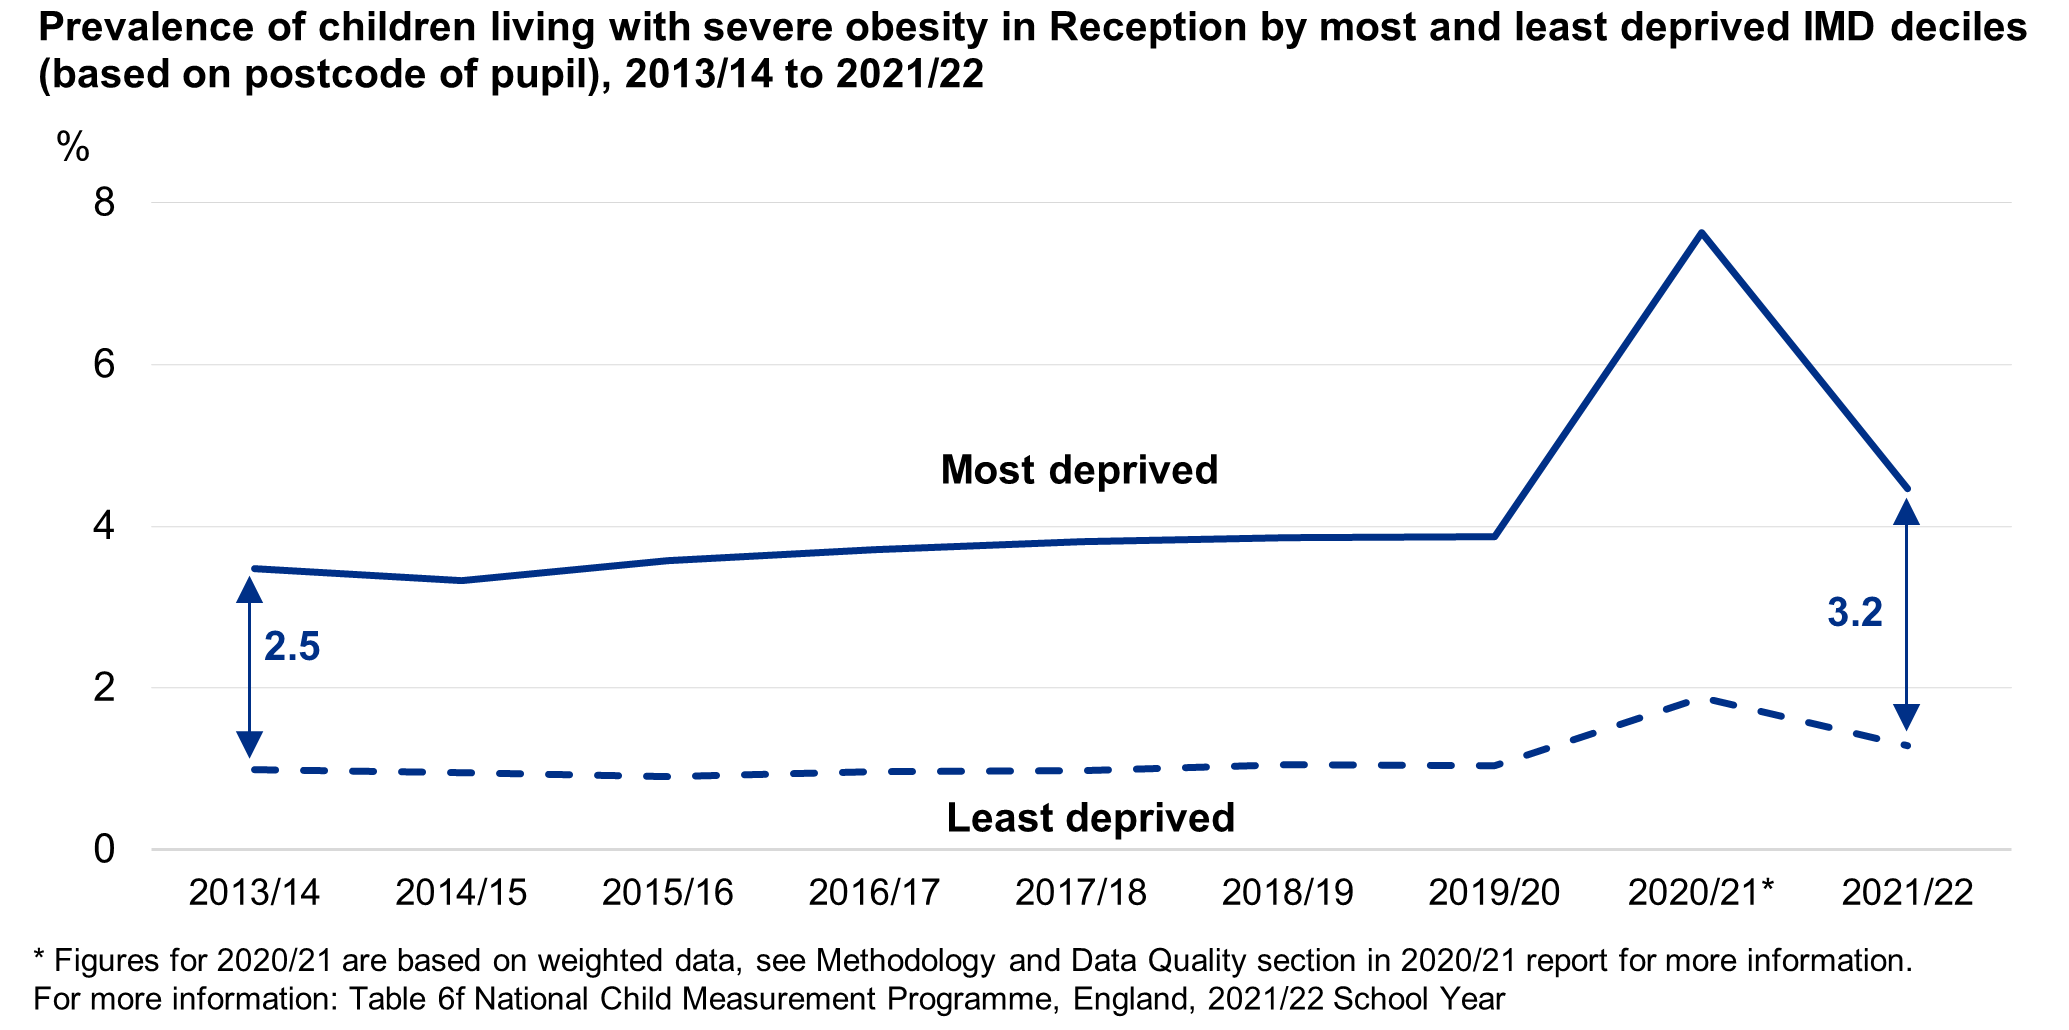
The prevalence of children living with severe obesity was over three times as high for children living in the most deprived areas (4.5%) than for children living in the least deprived areas (1.3%).
Time series deprivation data for children living with severe obesity
For children living in the most deprived areas, the prevalence of those living with severe obesity has increased from 3.5% in 2013/14 to 7.6% in 2020/21, the main year of the Covid-19 pandemic. This has decreased to 4.5% in 2021/22, which is an increase on the pre-pandemic levels.
For children living in the least deprived areas, the prevalence of those living with severe obesity increased from 1.0% in 2013/14 to 1.9% in 2020/21, the main year of the Covid-19 pandemic. This then decreased to 1.3% in 2021/22, which is higher than the pre-pandemic levels.
Between 2013/14 and 2021/22, the gap for children living in the most and least deprived areas increased by 0.7 percentage points due to the prevalence of children living with severe obesity increasing more in the most deprived areas.
For children living in the least deprived areas, the prevalence of boys living with severe obesity increased from 1.1% in 2013/14 to 2.0% in 2020/21, the main year of Covid-19 pandemic. This then decreased to 1.5% in 2021/22 though this is higher than the pre-pandemic levels. Over the same period the prevalence of severe obesity in girls remained at a similar level.
For children living in the most deprived areas, the prevalence of those living with severe obesity increased more for girls. The prevalence of boys living with severe obesity increased from 3.8% in 2013/14 to 8.2% in 2020/21, the main year of Covid-19 pandemic. This then decreased to 4.7% in 2021/22 though this is higher than the pre-pandemic levels. The prevalence of girls living with severe obesity increased from 3.1% in 2013/14 to 7.0% in 2020/21, the main year of Covid-19 pandemic. This then decreased to 4.2% in 2021/22 though this is higher than the pre-pandemic levels.
Overall, therefore, the increase in the gap over time was similar for boys and girls.

The combined prevalence of children who were overweight or living with obesity ranged from 26.9% for children living in the most deprived areas to 16.9% for children living in the least deprived areas.
For more information: Table 6a, National Child Measurement Programme, England, 2021/22 school year.
Year 6 – prevalence based on the deprivation where the child lives
Relationship between deprivation and prevalence of children living with obesity
The prevalence of children living with obesity was over twice as high for children living in the most deprived areas (31.3%) than for children living in the least deprived areas (13.5%).
Time series deprivation data for children living with obesity
For children living in the most deprived areas, the prevalence of those living with obesity increased from 24.6% in 2013/14 to 33.8% in 2020/21, the main year of the Covid-19 pandemic. This decreased to 31.3% in 2021/22, which is still higher than pre-pandemic levels.
For children living in the least deprived areas, the prevalence of those living with obesity increased from 11.8% in 2013/14 to 14.3% in 2020/21, the main year of the Covid-19 pandemic. This decreased to 13.5% in 2021/22, which is still higher than pre-pandemic levels.
The deprivation gap between children living in the most and least deprived areas increased by 4.9 percentage points between 2013/14 and 2021/22 due to the prevalence of children living with obesity increasing more in the most deprived areas.

For children living in the most deprived areas, the prevalence of those living with obesity increased in girls from 22.9% in 2013/14 to 27.9% in 2021/22 and for boys from 26.3% in 2013/14 to 34.6% in 2021/22.
For children living in the least deprived areas, the prevalence of children living with obesity increased in boys from 12.9% in 2013/14 to 15.7% in 2021/22 and for girls from 10.5% in 2013/14 to 11.3% in 2021/22.
Overall, the increase in the deprivation gap over time was similar for boys and girls.

Relationship between deprivation and prevalence of children living with severe obesity
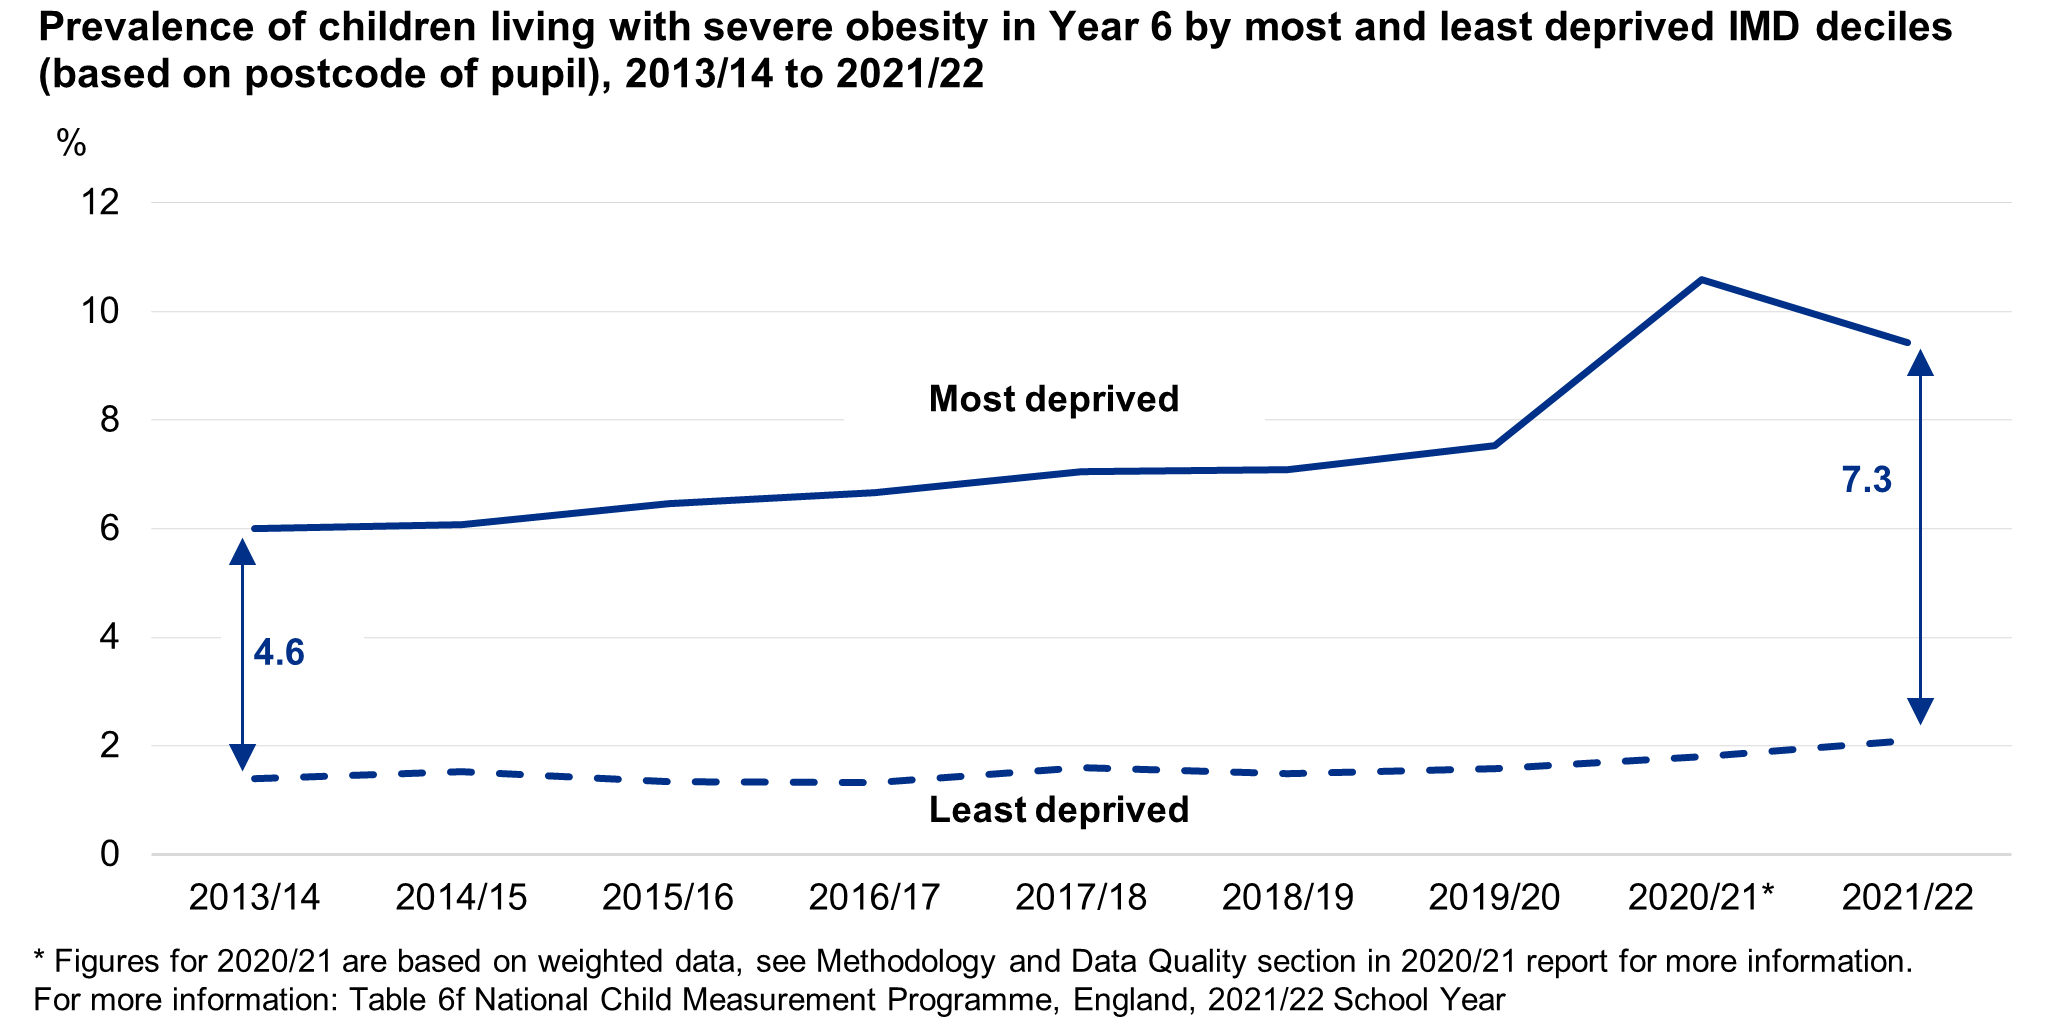
The prevalence of children living with severe obesity was over four times as high for children living in the most deprived areas (9.4% and 2.1% respectively).
Time series deprivation data for children living with severe obesity
For children living in the most deprived areas, the prevalence of those living with severe obesity increased from 6.0% in 2013/14 to 10.6% in 2020/21, the main year of the Covid-19 pandemic. This decreased to 9.4% in 2021/22, which is still higher than pre-pandemic levels.
For children living in the least deprived areas, the prevalence of those living with severe obesity increased from 1.4% in 2013/14 to 1.8% in 2020/21, the main year of the Covid-19 pandemic. This is similar to 2021/22 (2.1%).
Between 2013/14 and 2021/22, the deprivation gap between children living in the most and least deprived areas increased by 2.7 percentage points due to the prevalence of children living with severe obesity increasing more in the most deprived areas.
For children living in the least deprived areas, the prevalence of boys living with severe obesity increased from 1.7% in 2013/14 to 2.1% in 2020/21, the main year of Covid-19 pandemic. This then increased again to 2.6% in 2021/22. The prevalence of girls living with severe obesity increased from 1.1% in 2013/14 to 1.5% in 2020/21, the main year of Covid-19 pandemic which remained similar in 2021/22 at 1.6%.
For children living in the most deprived areas, the prevalence of boys living with severe obesity increased from 6.8% in 2013/14 to 12.7% in 2020/21, the main year of Covid-19 pandemic. This then decreased to 11.2% in 2021/22 which is still higher than the pre-pandemic levels. The prevalence of girls living with severe obesity increased from 5.2% in 2013/14 to 8.4% in 2020/21, the main year of Covid-19 pandemic. This then decreased to 7.6% in 2021/22 though this is higher than the pre-pandemic levels.
Overall, the deprivation gap has increased more for boys than girls.

The combined prevalence of children who were overweight or living with obesity ranged from 46.0% for children living in the most deprived areas to 26.3% for children living in the least deprived areas (not shown on chart).
For more information: Table 6a, National Child Measurement Programme, England, 2021/22 school year.
Reception – prevalence based on deprivation where the child attends school
Time series deprivation data for children living with obesity
For children attending schools in the most deprived areas, the prevalence of those living with obesity increased from 12.2% in 2006/07 to 19.7% in 2020/21, the main year of the Covid-19 pandemic. This decreased to 13.6% in 2021/22, which is still higher than pre-pandemic levels.
For children attending schools in the least deprived areas, the prevalence of those living with obesity increased from 7.7% in 2006/07 to 9.1% in 2020/21, the main year of the Covid-19 pandemic. This decreased to 6.8% in 2021/22, which is still higher than pre-pandemic levels.
Between 2006/07 and 2021/22 the deprivation gap for children attending schools in the most and least deprived areas increased by 2.3 percentage points due to the prevalence of children living with obesity increasing in the most deprived areas and reducing in the least deprived.
For children attending schools in the most deprived areas, the prevalence of those living with obesity increased in girls from 11.3% in 2006/07 to 13.2% in 2021/22 and for boys from 13.0% in 2006/07 to 13.9% in 2021/22.
For children attending schools in the least deprived areas, the prevalence of those living with obesity remained similar in girls (6.6% in 2021/22) and decreased for boys from 8.3% in 2006/07 to 6.9% in 2021/22.
Overall, the increase in the deprivation gap over time was similar for boys and girls.
Time series deprivation data for children living with severe obesity
For children attending schools in the most deprived areas, the prevalence of those living with severe obesity increased from 3.6% in 2006/07 to 7.4% in 2020/21, the main year of the Covid-19 pandemic. This decreased to 4.5% in 2021/22, which is still higher than pre-pandemic levels.
For children attending schools in the least deprived areas, the prevalence of those living with severe obesity increased from 1.5% in 2006/07 to 2.2% in 2020/21, the main year of the Covid-19 pandemic. This decreased to 1.5% in 2021/22, which is still higher than pre-pandemic levels.
Between 2006/07 and 2021/22, the deprivation gap for children attending schools in the most and least deprived areas increased by 0.9 percentage points due to prevalence of children living with severe obesity increasing in the most deprived areas and remaining similar in the least deprived.
For children attending schools in the least deprived areas, the prevalence of boys living with severe obesity increased from 1.7% in 2006/07 to 2.6% in 2020/21, the main year of Covid-19 pandemic. This then decreased to 1.7% in 2021/22 which is similar to pre-pandemic levels. The prevalence of girls living with severe obesity increased from 1.2% in 2006/07 to 1.8% in 2020/21, the main year of Covid-19 pandemic. This then decreased to 1.2% in 2021/22, which is higher than pre-pandemic levels.
For children attending schools in the most deprived areas, the prevalence of boys living with severe obesity increased from 4.0% in 2006/07 to 8.1% in 2020/21, the main year of Covid-19 pandemic. This then decreased to 4.9% in 2021/22 though this is higher than the pre-pandemic levels. The prevalence of girls living with severe obesity increased from 3.2% in 2006/07 to 6.6% in 2020/21, the main year of Covid-19 pandemic. This then decreased to 4.0% in 2021/22, which is still higher than pre-pandemic levels.
Overall, the increase in the gap over time was similar for boys and girls.
Year 6 – prevalence based on the deprivation where the child attends school
Time series deprivation data for children living with obesity
For children attending schools in the most deprived areas, the prevalence of those living with obesity increased from 21.5% in 2006/07 to 32.1% in 2020/21, the main year of the Covid-19 pandemic. This decreased to 30.7% in 2021/22, which is still higher than pre-pandemic levels.
For children attending schools in the least deprived areas, the prevalence of those living with obesity increased from 13.0% in 2006/07 to 15.5% in 2020/21, the main year of the Covid-19 pandemic. This was similar in 2021/22 (15.4%), but still higher than pre-pandemic levels.
Between 2006/07 and 2021/22 the deprivation gap for children attending schools in the most and least deprived areas increased by 6.8 percentage points due to the prevalence of children living with obesity increasing more in the most deprived areas.
For children attending schools in the most deprived areas, the prevalence of those living with obesity increased in girls from 20.1% in 2006/07 to 27.2% in 2021/22 and for boys from 22.9% in 2006/07 to 34.0% in 2021/22.
For children attending schools in the least deprived areas, the prevalence of those living with obesity increased in girls from 11.1% in 2006/07 to 13.2% in 2021/22 and for boys from 14.7% in 2006/07 to 17.5% in 2021/22.
Overall, the deprivation gap over time increased more for boys than girls.
Time series deprivation data for children living with severe obesity
For children attending schools in the most deprived areas, the prevalence of those living with severe obesity increased from 4.8% in 2006/07 to 9.5% in 2020/21, the main year of the Covid-19 pandemic. This remained similar in 2021/22 at 9.2%, which is still higher than pre-pandemic levels.
For children attending schools in the least deprived areas, the prevalence of those living with severe obesity increased from 1.7% in 2006/07 to 2.3% in 2020/21, the main year of the Covid-19 pandemic. This increased again to 2.6% in 2021/22, which is higher than pre-pandemic levels.
Between 2006/07 and 2021/22, the deprivation gap for children attending schools in the most and least deprived areas increased by 3.4 percentage points due to prevalence of children living with severe obesity increasing more in the most deprived areas.
For children attending schools in the least deprived areas, the prevalence of boys living with severe obesity increased from 2.1% in 2006/07 to 2.7% in 2020/21, the main year of Covid-19 pandemic. This then increased again to 3.2% in 2021/22, which is higher than pre-pandemic levels. The prevalence of girls living with severe obesity increased from 1.3% in 2006/07 to 1.9% in 2020/21, the main year of Covid-19 pandemic. This remained similar at 2.0% in 2021/22, which is higher than pre-pandemic levels.
For children attending schools in the most deprived areas, the prevalence of boys living with severe obesity increased from 5.4% in 2006/07 to 11.6% in 2020/21, the main year of Covid-19 pandemic. This then decreased to 10.8% in 2021/22 which is still higher than pre-pandemic levels. The prevalence of girls living with severe obesity increased from 4.3% in 2006/07 to 7.4% in 2020/21, the main year of Covid-19 pandemic. This remained similar at 7.6% in 2021/22, which is higher than pre-pandemic levels.
Overall, the deprivation gap increased more for boys than girls.
Last edited: 12 December 2022 1:37 pm