Publication, Part of Emergency Presentations of Cancer: Quarterly Data
Emergency Presentations of Cancer: Quarterly Data, Q1 to Q3 2021/22 (Apr to Dec 2021)
Official statistics
Update to ICD coding
The coding classification used has been updated from the original version of ICD-10 to ICD-10 revision 5. For more information see chapter ‘Things you need to know about this release’.
7 July 2022 09:30 AM
Variation over the Cancer Alliances
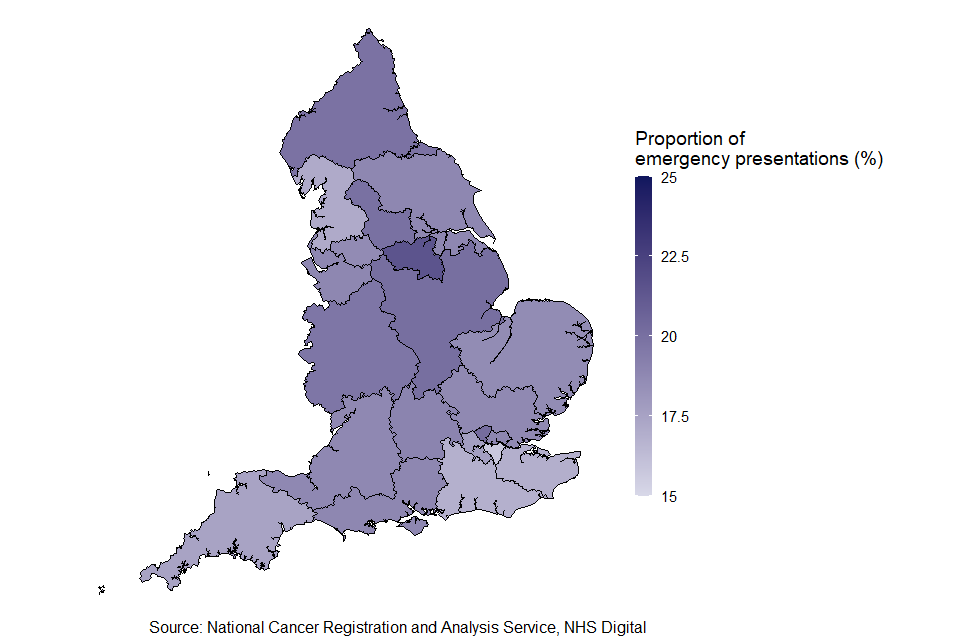
Proportion of cancer patients presenting as an emergency
Across the 21 Cancer Alliances (CAs), the proportion of cancer patients presenting as an emergency varied for the three most recent quarters (April to June 2021, July to September 2021 and October to December 2021) (Table 2). There are no obvious geographical patterns to the CA variation (Figure 4).
Table 2: Variation in the proportion of emergency presentations across 21 CAs
|
Quarter |
Minimum proportion |
25th Percentile |
75th Percentile |
Maximum proportion |
Interquartile range |
|
April to June 2021 |
18.5% |
19.5% |
22.1% |
23.2% |
2.5% |
|
July to September 2021 |
16.1% |
18.5% |
20.6% |
21.5% |
2.1% |
|
October to December 2021 |
15.8% |
17.7% |
19.7% |
21.5% |
2.0% |
1-year rolling proportion
The 1-year rolling proportions of cancer patients presenting as an emergency were either stable or decreasing for all CAs prior to the COVID-19 pandemic. Comparing April 2016 to March 2017 and April 2019 to March 2020 the 1-year rolling proportion of emergency presentations had not changed significantly for 16 CAs and had fallen significantly for 5 CAs.
Since the start of the COVID-19 pandemic the proportion of cancer patients presenting as an emergency increased for each 1-year rolling period which included the first national COVID-19 lockdown. Comparing April 2019 to March 2020 and April 2020 to March 2021 the proportion of cancer patients presenting as an emergency had risen significantly for all 21 CAs.
For the three most recent 1-year rolling periods, the proportion of cancer patients presenting as an emergency has been falling. Comparing April 2020 to March 2021 and January 2021 to December 2021, the 1-year rolling proportion has fallen significantly for all 21 CAs.
However, the 1-year rolling proportions are still higher than before the COVID-19 pandemic for the majority of CAs. Comparing January to December 2021 to January to December 2019, the 1-year rolling proportion was significantly higher for 12 CAs, had not changed significantly for 9 CAs and was not significantly lower for any CAs.
Last edited: 6 July 2022 2:32 pm