Introduction
This document summarises the National Congenital Condition and Rare Disease Registration Service (NCARDRS) congenital anomaly statistics 2019 report.
It is the fifth annual congenital anomaly statistics report released by NCARDRS and the second report to contain national data for the whole of England. The report contains information on congenital anomalies detected in babies delivered between 1 January and 31 December 2019.
About NCARDRS
NCARDRS is a comprehensive registration service that collects and quality assures data on congenital anomalies and rare diseases in England.
NCARDRS is made up of 10 regions – 7 of which have been conducting congenital anomaly registration for some time. The 3 new regions covering the East of England, London and the South East, and the North West were established and started data collection from 1 April 2017.
In 2018, NCARDRS achieved its goal of national data collection. This report, covering births between January and December 2019, across all 10 regions, represents the second year of national data coverage for England.
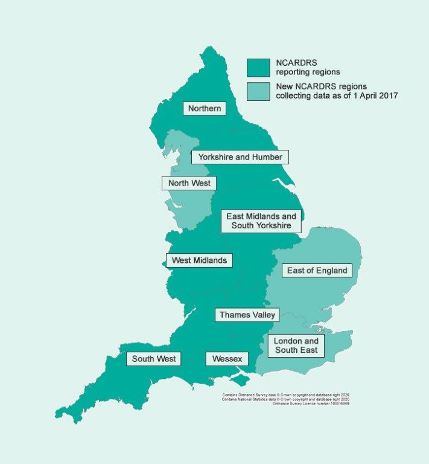
Figure 1: Map of NCARDRS reporting regions England, 2019.
This important and reliable information is available for clinicians, researchers, patients, and their families thanks to the dedication of notifying healthcare professionals.
Find out more about our congenital anomalies and rare disease self registration service.
2019 Prevalence
Congenital anomalies are defined as being present at delivery, probably originating before birth, and include structural, chromosomal, and genetic conditions.

NCARDRS currently collects data on >1,400 different congenital anomalies and rare diseases. In 2019, there were a total of 13,306 babies with one or more congenital anomalies notified to NCARDRS covering 614,952 total births (live births and stillbirths).
Some babies have more than one anomaly. A total of 145 babies in 2019 had a structural anomaly, a chromosomal anomaly, and a serious cardiac anomaly.

Figure 2: Multiple anomalies: babies with severe cardiac, chromosomal and/or other anomalies, in England, 2019.
Timing of diagnosis
Some congenital anomalies are detectable during pregnancy and others are not. Screening programmes are offered by NHS maternity services to maximise antenatal detection of specified conditions where women choose and present in time to have screening.
In 2019, the timing of the first diagnosis was known for 12,674 babies (95.0%) and of these, 68.0% of pregnancies with a congenital anomaly were detected antenatally. Babies with abdominal wall (95.7%) and skeletal dysplasia (93.6%) conditions are the most likely to be detected antenatally.

Figure 3: Timing of first diagnosis in England, 2019, 68% Antenatally and 32% postnatally.
Perinatal and infant mortality
Of the 9,770 live births diagnosed with a congenital anomaly, 633 died in infancy, giving an infant mortality rate of 10.3 per 10,000 live births. Congenital heart anomalies were associated with 51.8% of infant deaths with a congenital anomaly, followed by chromosomal anomalies (22.7%) and digestive system anomalies (18.3%).

Maternal age
Lower and higher maternal age are linked with an increase in certain congenital anomalies. Data recorded in 2019 shows prevalence of genetic chromosomal anomalies was approximately 9 times higher in older mothers (women aged 40+) compared with younger mothers (women aged less than 20). Some structural anomalies are more common in younger women – gastroschisis, an abdominal wall condition, is most common in women aged less than 20 years.

Down’s syndrome, Edwards’ syndrome and Patau’s syndrome in 2019
The prevalence per 10,000 total births for:
- Down’s syndrome was 25.4 (95% CI: 24.1-26.6), or 1 in 394 total births
- Edwards’ syndrome was 6.9 (95% CI: 6.2-7.6), or 1 in 1,449 total births
- Patau’s syndrome was 2.5 (95% CI: 2.1-2.9), or 1 in 4,000 total births

Last edited: 15 July 2026 10:23 am
